
 Yahoo Finance
 Is Ingenico Group – GCS (EPA:ING) A Financially Sound Company?

Small and large cap stocks are widely popular for a variety of reasons, however, mid-cap companies such as Ingenico Group – GCS (EPA:ING), with a market cap of €3.9b, often get neglected by retail investors. However, generally ignored mid-caps have historically delivered better risk-adjusted returns than the two other categories of stocks. Let’s take a look at ING’s debt concentration and assess their financial liquidity to get an idea of their ability to fund strategic acquisitions and grow through cyclical pressures. Note that this information is centred entirely on financial health and is a top-level understanding, so I encourage you to look further into ING here.
View our latest analysis for Ingenico Group – GCS
Does ING Produce Much Cash Relative To Its Debt?
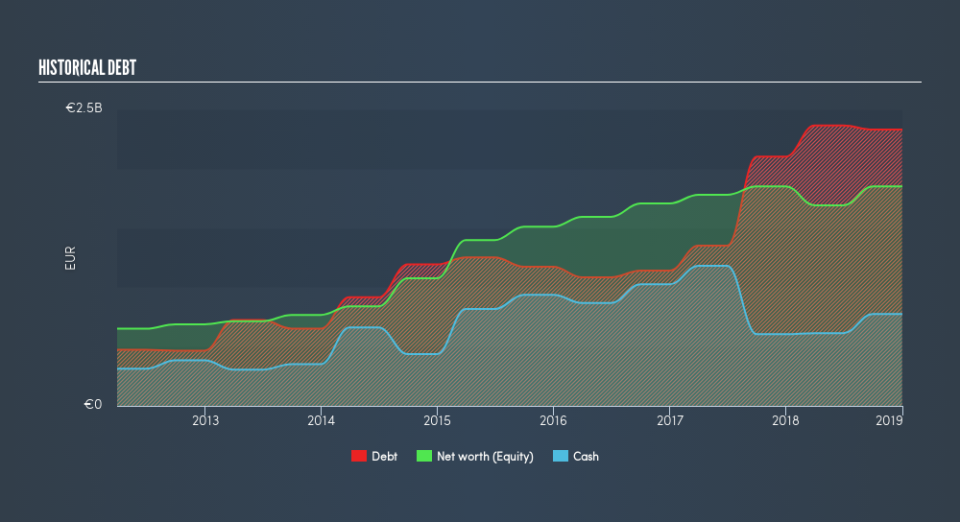
ING has built up its total debt levels in the last twelve months, from €2.1b to €2.3b , which includes long-term debt. With this increase in debt, the current cash and short-term investment levels stands at €775m , ready to be used for running the business. On top of this, ING has generated cash from operations of €339m over the same time period, leading to an operating cash to total debt ratio of 15%, indicating that ING’s debt is not covered by operating cash.
Does ING’s liquid assets cover its short-term commitments?
Looking at ING’s €2.1b in current liabilities, it appears that the company has been able to meet these obligations given the level of current assets of €2.4b, with a current ratio of 1.17x. The current ratio is calculated by dividing current assets by current liabilities. For Electronic companies, this ratio is within a sensible range since there is a bit of a cash buffer without leaving too much capital in a low-return environment.
Is ING’s debt level acceptable?
With total debt exceeding equity, ING is considered a highly levered company. This is not uncommon for a mid-cap company given that debt tends to be lower-cost and at times, more accessible. We can check to see whether ING is able to meet its debt obligations by looking at the net interest coverage ratio. A company generating earnings before interest and tax (EBIT) at least three times its net interest payments is considered financially sound. In ING’s, case, the ratio of 7.32x suggests that interest is appropriately covered, which means that debtors may be willing to loan the company more money, giving ING ample headroom to grow its debt facilities.
Next Steps:
ING’s high cash coverage means that, although its debt levels are high, the company is able to utilise its borrowings efficiently in order to generate cash flow. Since there is also no concerns around ING’s liquidity needs, this may be its optimal capital structure for the time being. I admit this is a fairly basic analysis for ING’s financial health. Other important fundamentals need to be considered alongside. I recommend you continue to research Ingenico Group – GCS to get a better picture of the mid-cap by looking at:
Future Outlook: What are well-informed industry analysts predicting for ING’s future growth? Take a look at our free research report of analyst consensus for ING’s outlook.
Valuation: What is ING worth today? Is the stock undervalued, even when its growth outlook is factored into its intrinsic value? The intrinsic value infographic in our free research report helps visualize whether ING is currently mispriced by the market.
Other High-Performing Stocks: Are there other stocks that provide better prospects with proven track records? Explore our free list of these great stocks here.
We aim to bring you long-term focused research analysis driven by fundamental data. Note that our analysis may not factor in the latest price-sensitive company announcements or qualitative material.
If you spot an error that warrants correction, please contact the editor at editorial-team@simplywallst.com. This article by Simply Wall St is general in nature. It does not constitute a recommendation to buy or sell any stock, and does not take account of your objectives, or your financial situation. Simply Wall St has no position in the stocks mentioned. Thank you for reading.
