
 Yahoo Finance
 Is Ingenico Group - GCS's (EPA:ING) High P/E Ratio A Problem For Investors?

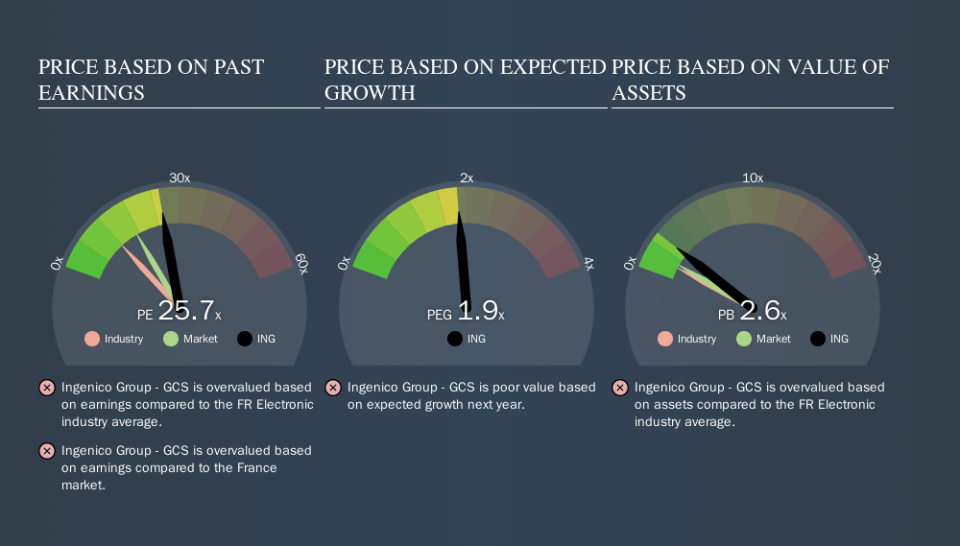
The goal of this article is to teach you how to use price to earnings ratios (P/E ratios). To keep it practical, we'll show how Ingenico Group - GCS's (EPA:ING) P/E ratio could help you assess the value on offer. Ingenico Group - GCS has a price to earnings ratio of 25.67, based on the last twelve months. That means that at current prices, buyers pay €25.67 for every €1 in trailing yearly profits.
View our latest analysis for Ingenico Group - GCS
How Do You Calculate A P/E Ratio?
The formula for P/E is:
Price to Earnings Ratio = Price per Share ÷ Earnings per Share (EPS)
Or for Ingenico Group - GCS:
P/E of 25.67 = €89.06 ÷ €3.47 (Based on the year to June 2019.)
Is A High Price-to-Earnings Ratio Good?
The higher the P/E ratio, the higher the price tag of a business, relative to its trailing earnings. That isn't a good or a bad thing on its own, but a high P/E means that buyers have a higher opinion of the business's prospects, relative to stocks with a lower P/E.
How Does Ingenico Group - GCS's P/E Ratio Compare To Its Peers?
The P/E ratio essentially measures market expectations of a company. You can see in the image below that the average P/E (11.8) for companies in the electronic industry is lower than Ingenico Group - GCS's P/E.
Ingenico Group - GCS's P/E tells us that market participants think the company will perform better than its industry peers, going forward. Shareholders are clearly optimistic, but the future is always uncertain. So investors should always consider the P/E ratio alongside other factors, such as whether company directors have been buying shares.
How Growth Rates Impact P/E Ratios
Companies that shrink earnings per share quickly will rapidly decrease the 'E' in the equation. That means unless the share price falls, the P/E will increase in a few years. Then, a higher P/E might scare off shareholders, pushing the share price down.
It's great to see that Ingenico Group - GCS grew EPS by 22% in the last year. And it has bolstered its earnings per share by 4.8% per year over the last five years. With that performance, you might expect an above average P/E ratio. In contrast, EPS has decreased by 2.9%, annually, over 3 years.
Remember: P/E Ratios Don't Consider The Balance Sheet
The 'Price' in P/E reflects the market capitalization of the company. So it won't reflect the advantage of cash, or disadvantage of debt. The exact same company would hypothetically deserve a higher P/E ratio if it had a strong balance sheet, than if it had a weak one with lots of debt, because a cashed up company can spend on growth.
Such spending might be good or bad, overall, but the key point here is that you need to look at debt to understand the P/E ratio in context.
How Does Ingenico Group - GCS's Debt Impact Its P/E Ratio?
Net debt is 27% of Ingenico Group - GCS's market cap. While it's worth keeping this in mind, it isn't a worry.
The Bottom Line On Ingenico Group - GCS's P/E Ratio
Ingenico Group - GCS trades on a P/E ratio of 25.7, which is above its market average of 17.1. The company is not overly constrained by its modest debt levels, and its recent EPS growth very solid. So on this analysis it seems reasonable that its P/E ratio is above average.
Investors have an opportunity when market expectations about a stock are wrong. If the reality for a company is better than it expects, you can make money by buying and holding for the long term. So this free visualization of the analyst consensus on future earnings could help you make the right decision about whether to buy, sell, or hold.
Of course, you might find a fantastic investment by looking at a few good candidates. So take a peek at this free list of companies with modest (or no) debt, trading on a P/E below 20.
We aim to bring you long-term focused research analysis driven by fundamental data. Note that our analysis may not factor in the latest price-sensitive company announcements or qualitative material.
If you spot an error that warrants correction, please contact the editor at editorial-team@simplywallst.com. This article by Simply Wall St is general in nature. It does not constitute a recommendation to buy or sell any stock, and does not take account of your objectives, or your financial situation. Simply Wall St has no position in the stocks mentioned. Thank you for reading.
