
 Yahoo Finance
 Is Ingenico Group - GCS's (EPA:ING) High P/E Ratio A Problem For Investors?

Want to participate in a research study? Help shape the future of investing tools and earn a $60 gift card!
This article is written for those who want to get better at using price to earnings ratios (P/E ratios). We'll look at Ingenico Group - GCS's (EPA:ING) P/E ratio and reflect on what it tells us about the company's share price. What is Ingenico Group - GCS's P/E ratio? Well, based on the last twelve months it is 21.85. That is equivalent to an earnings yield of about 4.6%.
See our latest analysis for Ingenico Group - GCS
How Do You Calculate A P/E Ratio?
The formula for P/E is:
Price to Earnings Ratio = Price per Share ÷ Earnings per Share (EPS)
Or for Ingenico Group - GCS:
P/E of 21.85 = €66.62 ÷ €3.05 (Based on the year to December 2018.)
Is A High P/E Ratio Good?
The higher the P/E ratio, the higher the price tag of a business, relative to its trailing earnings. That isn't necessarily good or bad, but a high P/E implies relatively high expectations of what a company can achieve in the future.
How Growth Rates Impact P/E Ratios
If earnings fall then in the future the 'E' will be lower. That means unless the share price falls, the P/E will increase in a few years. Then, a higher P/E might scare off shareholders, pushing the share price down.
Ingenico Group - GCS shrunk earnings per share by 26% over the last year. But EPS is up 7.0% over the last 5 years. And it has shrunk its earnings per share by 7.1% per year over the last three years. This growth rate might warrant a low P/E ratio.
Does Ingenico Group - GCS Have A Relatively High Or Low P/E For Its Industry?
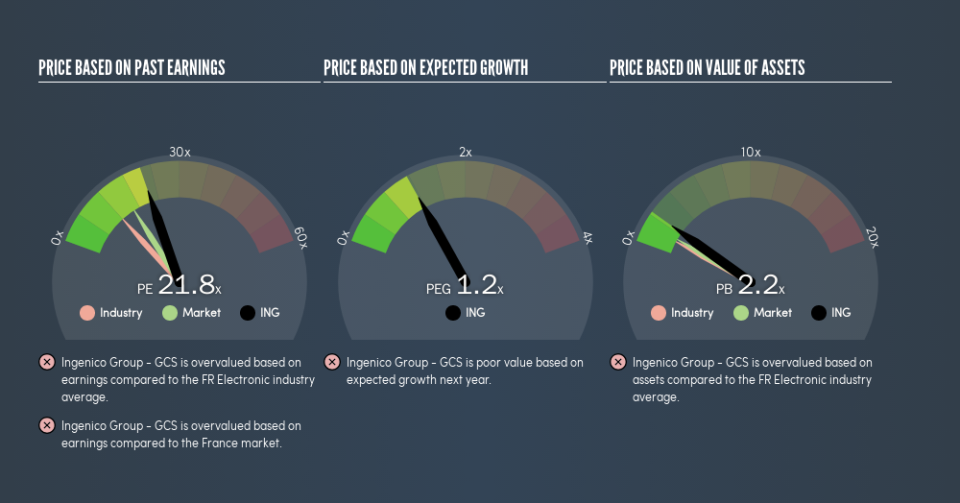
The P/E ratio indicates whether the market has higher or lower expectations of a company. The image below shows that Ingenico Group - GCS has a higher P/E than the average (12) P/E for companies in the electronic industry.
Its relatively high P/E ratio indicates that Ingenico Group - GCS shareholders think it will perform better than other companies in its industry classification. The market is optimistic about the future, but that doesn't guarantee future growth. So investors should delve deeper. I like to check if company insiders have been buying or selling.
Remember: P/E Ratios Don't Consider The Balance Sheet
The 'Price' in P/E reflects the market capitalization of the company. Thus, the metric does not reflect cash or debt held by the company. Theoretically, a business can improve its earnings (and produce a lower P/E in the future) by investing in growth. That means taking on debt (or spending its cash).
Such spending might be good or bad, overall, but the key point here is that you need to look at debt to understand the P/E ratio in context.
Ingenico Group - GCS's Balance Sheet
Ingenico Group - GCS's net debt equates to 38% of its market capitalization. You'd want to be aware of this fact, but it doesn't bother us.
The Verdict On Ingenico Group - GCS's P/E Ratio
Ingenico Group - GCS has a P/E of 21.8. That's higher than the average in the FR market, which is 16.2. With modest debt but no EPS growth in the last year, it's fair to say the P/E implies some optimism about future earnings, from the market.
Investors should be looking to buy stocks that the market is wrong about. As value investor Benjamin Graham famously said, 'In the short run, the market is a voting machine but in the long run, it is a weighing machine.' So this free report on the analyst consensus forecasts could help you make a master move on this stock.
Of course, you might find a fantastic investment by looking at a few good candidates. So take a peek at this free list of companies with modest (or no) debt, trading on a P/E below 20.
We aim to bring you long-term focused research analysis driven by fundamental data. Note that our analysis may not factor in the latest price-sensitive company announcements or qualitative material.
If you spot an error that warrants correction, please contact the editor at editorial-team@simplywallst.com. This article by Simply Wall St is general in nature. It does not constitute a recommendation to buy or sell any stock, and does not take account of your objectives, or your financial situation. Simply Wall St has no position in the stocks mentioned. Thank you for reading.
