
 Yahoo Finance
 INSPECS Group (LON:SPEC) May Have Issues Allocating Its Capital
Did you know there are some financial metrics that can provide clues of a potential multi-bagger? Firstly, we'd want to identify a growing return on capital employed (ROCE) and then alongside that, an ever-increasing base of capital employed. This shows us that it's a compounding machine, able to continually reinvest its earnings back into the business and generate higher returns. In light of that, when we looked at INSPECS Group (LON:SPEC) and its ROCE trend, we weren't exactly thrilled.
Understanding Return On Capital Employed (ROCE)
If you haven't worked with ROCE before, it measures the 'return' (pre-tax profit) a company generates from capital employed in its business. Analysts use this formula to calculate it for INSPECS Group:
Return on Capital Employed = Earnings Before Interest and Tax (EBIT) ÷ (Total Assets - Current Liabilities)
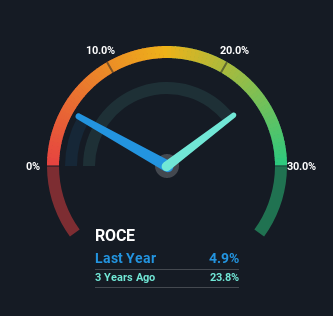
0.049 = US$11m ÷ (US$302m - US$79m) (Based on the trailing twelve months to June 2022).
Thus, INSPECS Group has an ROCE of 4.9%. Ultimately, that's a low return and it under-performs the Medical Equipment industry average of 9.9%.
See our latest analysis for INSPECS Group
Above you can see how the current ROCE for INSPECS Group compares to its prior returns on capital, but there's only so much you can tell from the past. If you'd like, you can check out the forecasts from the analysts covering INSPECS Group here for free.
So How Is INSPECS Group's ROCE Trending?
On the surface, the trend of ROCE at INSPECS Group doesn't inspire confidence. Around five years ago the returns on capital were 15%, but since then they've fallen to 4.9%. However, given capital employed and revenue have both increased it appears that the business is currently pursuing growth, at the consequence of short term returns. And if the increased capital generates additional returns, the business, and thus shareholders, will benefit in the long run.
On a side note, INSPECS Group has done well to pay down its current liabilities to 26% of total assets. That could partly explain why the ROCE has dropped. What's more, this can reduce some aspects of risk to the business because now the company's suppliers or short-term creditors are funding less of its operations. Some would claim this reduces the business' efficiency at generating ROCE since it is now funding more of the operations with its own money.
Our Take On INSPECS Group's ROCE
In summary, despite lower returns in the short term, we're encouraged to see that INSPECS Group is reinvesting for growth and has higher sales as a result. However, despite the promising trends, the stock has fallen 49% over the last three years, so there might be an opportunity here for astute investors. So we think it'd be worthwhile to look further into this stock given the trends look encouraging.
INSPECS Group does come with some risks though, we found 3 warning signs in our investment analysis, and 2 of those are a bit concerning...
If you want to search for solid companies with great earnings, check out this free list of companies with good balance sheets and impressive returns on equity.
Have feedback on this article? Concerned about the content? Get in touch with us directly. Alternatively, email editorial-team (at) simplywallst.com.
This article by Simply Wall St is general in nature. We provide commentary based on historical data and analyst forecasts only using an unbiased methodology and our articles are not intended to be financial advice. It does not constitute a recommendation to buy or sell any stock, and does not take account of your objectives, or your financial situation. We aim to bring you long-term focused analysis driven by fundamental data. Note that our analysis may not factor in the latest price-sensitive company announcements or qualitative material. Simply Wall St has no position in any stocks mentioned.
Join A Paid User Research Session
You’ll receive a US$30 Amazon Gift card for 1 hour of your time while helping us build better investing tools for the individual investors like yourself. Sign up here
