
 Yahoo Finance
 Institutional investors may adopt severe steps after Anglo American plc's (LON:AAL) latest 4.6% drop adds to a year losses
Key Insights
Significantly high institutional ownership implies Anglo American's stock price is sensitive to their trading actions
The top 20 shareholders own 51% of the company
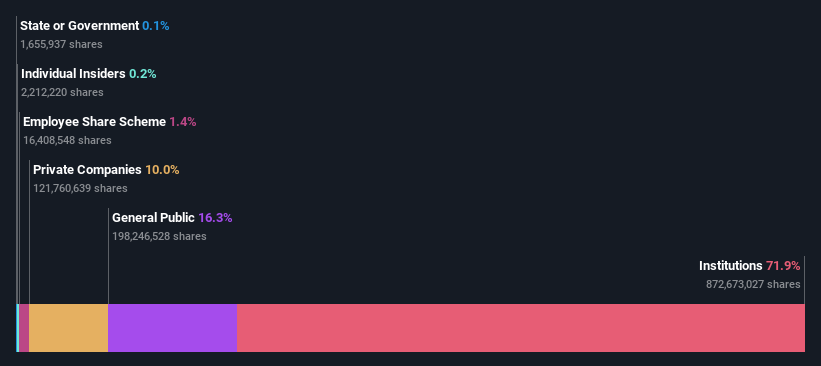
A look at the shareholders of Anglo American plc (LON:AAL) can tell us which group is most powerful. With 72% stake, institutions possess the maximum shares in the company. Put another way, the group faces the maximum upside potential (or downside risk).
And so it follows that institutional investors was the group most impacted after the company's market cap fell to UK£31b last week after a 4.6% drop in the share price. This set of investors may especially be concerned about the current loss, which adds to a one-year loss of 22% for shareholders. Also referred to as "smart money", institutions have a lot of sway over how a stock's price moves. As a result, if the downtrend continues, institutions may face pressures to sell Anglo American, which might have negative implications on individual investors.
Let's delve deeper into each type of owner of Anglo American, beginning with the chart below.
See our latest analysis for Anglo American
What Does The Institutional Ownership Tell Us About Anglo American?
Many institutions measure their performance against an index that approximates the local market. So they usually pay more attention to companies that are included in major indices.
As you can see, institutional investors have a fair amount of stake in Anglo American. This can indicate that the company has a certain degree of credibility in the investment community. However, it is best to be wary of relying on the supposed validation that comes with institutional investors. They too, get it wrong sometimes. If multiple institutions change their view on a stock at the same time, you could see the share price drop fast. It's therefore worth looking at Anglo American's earnings history below. Of course, the future is what really matters.
Since institutional investors own more than half the issued stock, the board will likely have to pay attention to their preferences. Anglo American is not owned by hedge funds. Looking at our data, we can see that the largest shareholder is BlackRock, Inc. with 9.1% of shares outstanding. In comparison, the second and third largest shareholders hold about 7.7% and 4.4% of the stock.
A closer look at our ownership figures suggests that the top 20 shareholders have a combined ownership of 51% implying that no single shareholder has a majority.
While studying institutional ownership for a company can add value to your research, it is also a good practice to research analyst recommendations to get a deeper understand of a stock's expected performance. There are a reasonable number of analysts covering the stock, so it might be useful to find out their aggregate view on the future.
Insider Ownership Of Anglo American
While the precise definition of an insider can be subjective, almost everyone considers board members to be insiders. The company management answer to the board and the latter should represent the interests of shareholders. Notably, sometimes top-level managers are on the board themselves.
I generally consider insider ownership to be a good thing. However, on some occasions it makes it more difficult for other shareholders to hold the board accountable for decisions.
Our data suggests that insiders own under 1% of Anglo American plc in their own names. However, it's possible that insiders might have an indirect interest through a more complex structure. Being so large, we would not expect insiders to own a large proportion of the stock. Collectively, they own UK£56m of stock. Arguably recent buying and selling is just as important to consider. You can click here to see if insiders have been buying or selling.
General Public Ownership
The general public, who are usually individual investors, hold a 16% stake in Anglo American. While this group can't necessarily call the shots, it can certainly have a real influence on how the company is run.
Private Company Ownership
We can see that Private Companies own 10%, of the shares on issue. Private companies may be related parties. Sometimes insiders have an interest in a public company through a holding in a private company, rather than in their own capacity as an individual. While it's hard to draw any broad stroke conclusions, it is worth noting as an area for further research.
Next Steps:
While it is well worth considering the different groups that own a company, there are other factors that are even more important. Consider for instance, the ever-present spectre of investment risk. We've identified 4 warning signs with Anglo American (at least 1 which is a bit unpleasant) , and understanding them should be part of your investment process.
But ultimately it is the future, not the past, that will determine how well the owners of this business will do. Therefore we think it advisable to take a look at this free report showing whether analysts are predicting a brighter future.
NB: Figures in this article are calculated using data from the last twelve months, which refer to the 12-month period ending on the last date of the month the financial statement is dated. This may not be consistent with full year annual report figures.
Have feedback on this article? Concerned about the content? Get in touch with us directly. Alternatively, email editorial-team (at) simplywallst.com.
This article by Simply Wall St is general in nature. We provide commentary based on historical data and analyst forecasts only using an unbiased methodology and our articles are not intended to be financial advice. It does not constitute a recommendation to buy or sell any stock, and does not take account of your objectives, or your financial situation. We aim to bring you long-term focused analysis driven by fundamental data. Note that our analysis may not factor in the latest price-sensitive company announcements or qualitative material. Simply Wall St has no position in any stocks mentioned.
Join A Paid User Research Session
You’ll receive a US$30 Amazon Gift card for 1 hour of your time while helping us build better investing tools for the individual investors like yourself. Sign up here
