
 Yahoo Finance
 IntegraFin Holdings (LON:IHP) stock falls 6.9% in past week as three-year earnings and shareholder returns continue downward trend
If you are building a properly diversified stock portfolio, the chances are some of your picks will perform badly. But long term IntegraFin Holdings plc (LON:IHP) shareholders have had a particularly rough ride in the last three year. Regrettably, they have had to cope with a 54% drop in the share price over that period. Even worse, it's down 12% in about a month, which isn't fun at all.
After losing 6.9% this past week, it's worth investigating the company's fundamentals to see what we can infer from past performance.
View our latest analysis for IntegraFin Holdings
While markets are a powerful pricing mechanism, share prices reflect investor sentiment, not just underlying business performance. By comparing earnings per share (EPS) and share price changes over time, we can get a feel for how investor attitudes to a company have morphed over time.
IntegraFin Holdings saw its EPS decline at a compound rate of 4.1% per year, over the last three years. The share price decline of 23% is actually steeper than the EPS slippage. So it's likely that the EPS decline has disappointed the market, leaving investors hesitant to buy.
You can see below how EPS has changed over time (discover the exact values by clicking on the image).
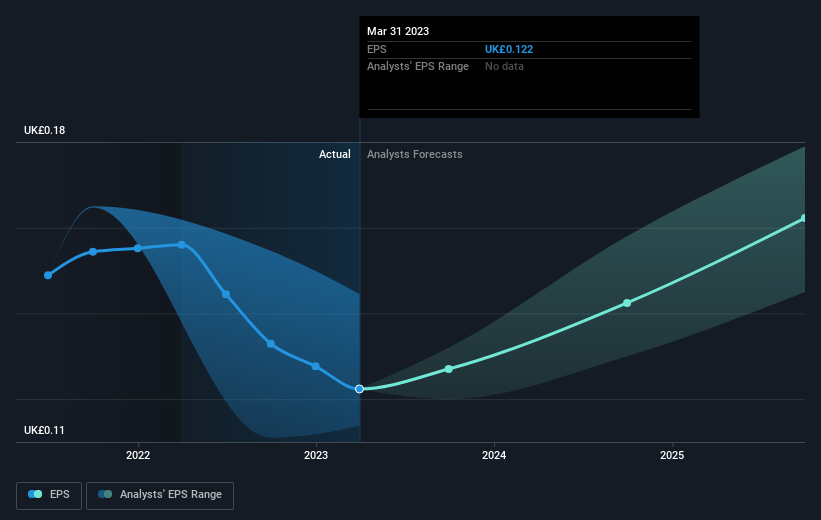
Dive deeper into IntegraFin Holdings' key metrics by checking this interactive graph of IntegraFin Holdings's earnings, revenue and cash flow.
What About Dividends?
It is important to consider the total shareholder return, as well as the share price return, for any given stock. The TSR incorporates the value of any spin-offs or discounted capital raisings, along with any dividends, based on the assumption that the dividends are reinvested. Arguably, the TSR gives a more comprehensive picture of the return generated by a stock. We note that for IntegraFin Holdings the TSR over the last 3 years was -51%, which is better than the share price return mentioned above. And there's no prize for guessing that the dividend payments largely explain the divergence!
A Different Perspective
It's good to see that IntegraFin Holdings has rewarded shareholders with a total shareholder return of 1.8% in the last twelve months. Of course, that includes the dividend. Notably the five-year annualised TSR loss of 6% per year compares very unfavourably with the recent share price performance. The long term loss makes us cautious, but the short term TSR gain certainly hints at a brighter future. While it is well worth considering the different impacts that market conditions can have on the share price, there are other factors that are even more important. For instance, we've identified 1 warning sign for IntegraFin Holdings that you should be aware of.
Of course, you might find a fantastic investment by looking elsewhere. So take a peek at this free list of companies we expect will grow earnings.
Please note, the market returns quoted in this article reflect the market weighted average returns of stocks that currently trade on British exchanges.
Have feedback on this article? Concerned about the content? Get in touch with us directly. Alternatively, email editorial-team (at) simplywallst.com.
This article by Simply Wall St is general in nature. We provide commentary based on historical data and analyst forecasts only using an unbiased methodology and our articles are not intended to be financial advice. It does not constitute a recommendation to buy or sell any stock, and does not take account of your objectives, or your financial situation. We aim to bring you long-term focused analysis driven by fundamental data. Note that our analysis may not factor in the latest price-sensitive company announcements or qualitative material. Simply Wall St has no position in any stocks mentioned.
Join A Paid User Research Session
You’ll receive a US$30 Amazon Gift card for 1 hour of your time while helping us build better investing tools for the individual investors like yourself. Sign up here
