
 Yahoo Finance
 Integrated Diagnostics Holdings plc's (LON:IDHC) Intrinsic Value Is Potentially 63% Above Its Share Price
Key Insights
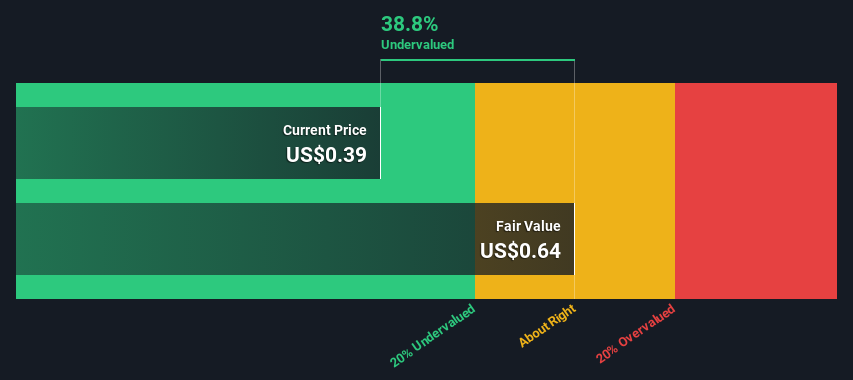
The projected fair value for Integrated Diagnostics Holdings is US$0.64 based on Dividend Discount Model
Current share price of US$0.39 suggests Integrated Diagnostics Holdings is potentially 39% undervalued
When compared to theindustry average discount to fair value of 54%, Integrated Diagnostics Holdings' competitors seem to be trading at a greater discount
Today we will run through one way of estimating the intrinsic value of Integrated Diagnostics Holdings plc (LON:IDHC) by projecting its future cash flows and then discounting them to today's value. This will be done using the Discounted Cash Flow (DCF) model. There's really not all that much to it, even though it might appear quite complex.
Remember though, that there are many ways to estimate a company's value, and a DCF is just one method. For those who are keen learners of equity analysis, the Simply Wall St analysis model here may be something of interest to you.
Check out our latest analysis for Integrated Diagnostics Holdings
Is Integrated Diagnostics Holdings Fairly Valued?
As Integrated Diagnostics Holdings operates in the healthcare sector, we need to calculate the intrinsic value slightly differently. Instead of using free cash flows, which are hard to estimate and often not reported by analysts in this industry, dividends per share (DPS) payments are used. Unless a company pays out the majority of its FCF as a dividend, this method will typically underestimate the value of the stock. The 'Gordon Growth Model' is used, which simply assumes that dividend payments will continue to increase at a sustainable growth rate forever. For a number of reasons a very conservative growth rate is used that cannot exceed that of a company's Gross Domestic Product (GDP). In this case we used the 5-year average of the 10-year government bond yield (1.6%). The expected dividend per share is then discounted to today's value at a cost of equity of 6.0%. Relative to the current share price of US$0.4, the company appears quite good value at a 39% discount to where the stock price trades currently. Valuations are imprecise instruments though, rather like a telescope - move a few degrees and end up in a different galaxy. Do keep this in mind.
Value Per Share = Expected Dividend Per Share / (Discount Rate - Perpetual Growth Rate)
= ج.م1.4 / (6.0% – 1.6%)
= US$0.6
Important Assumptions
The calculation above is very dependent on two assumptions. The first is the discount rate and the other is the cash flows. Part of investing is coming up with your own evaluation of a company's future performance, so try the calculation yourself and check your own assumptions. The DCF also does not consider the possible cyclicality of an industry, or a company's future capital requirements, so it does not give a full picture of a company's potential performance. Given that we are looking at Integrated Diagnostics Holdings as potential shareholders, the cost of equity is used as the discount rate, rather than the cost of capital (or weighted average cost of capital, WACC) which accounts for debt. In this calculation we've used 6.0%, which is based on a levered beta of 0.800. Beta is a measure of a stock's volatility, compared to the market as a whole. We get our beta from the industry average beta of globally comparable companies, with an imposed limit between 0.8 and 2.0, which is a reasonable range for a stable business.
SWOT Analysis for Integrated Diagnostics Holdings
Strength
Debt is not viewed as a risk.
Weakness
Earnings declined over the past year.
Opportunity
Annual earnings are forecast to grow faster than the British market.
Good value based on P/E ratio and estimated fair value.
Threat
No apparent threats visible for IDHC.
Next Steps:
Valuation is only one side of the coin in terms of building your investment thesis, and it shouldn't be the only metric you look at when researching a company. DCF models are not the be-all and end-all of investment valuation. Instead the best use for a DCF model is to test certain assumptions and theories to see if they would lead to the company being undervalued or overvalued. If a company grows at a different rate, or if its cost of equity or risk free rate changes sharply, the output can look very different. Can we work out why the company is trading at a discount to intrinsic value? For Integrated Diagnostics Holdings, we've compiled three relevant elements you should look at:
Risks: For example, we've discovered 1 warning sign for Integrated Diagnostics Holdings that you should be aware of before investing here.
Future Earnings: How does IDHC's growth rate compare to its peers and the wider market? Dig deeper into the analyst consensus number for the upcoming years by interacting with our free analyst growth expectation chart.
Other High Quality Alternatives: Do you like a good all-rounder? Explore our interactive list of high quality stocks to get an idea of what else is out there you may be missing!
PS. Simply Wall St updates its DCF calculation for every British stock every day, so if you want to find the intrinsic value of any other stock just search here.
Have feedback on this article? Concerned about the content? Get in touch with us directly. Alternatively, email editorial-team (at) simplywallst.com.
This article by Simply Wall St is general in nature. We provide commentary based on historical data and analyst forecasts only using an unbiased methodology and our articles are not intended to be financial advice. It does not constitute a recommendation to buy or sell any stock, and does not take account of your objectives, or your financial situation. We aim to bring you long-term focused analysis driven by fundamental data. Note that our analysis may not factor in the latest price-sensitive company announcements or qualitative material. Simply Wall St has no position in any stocks mentioned.
