
 Yahoo Finance
 Integrated Research (ASX:IRI) shareholders have endured a 56% loss from investing in the stock a year ago
Taking the occasional loss comes part and parcel with investing on the stock market. Anyone who held Integrated Research Limited (ASX:IRI) over the last year knows what a loser feels like. In that relatively short period, the share price has plunged 56%. At least the damage isn't so bad if you look at the last three years, since the stock is down 24% in that time. Shareholders have had an even rougher run lately, with the share price down 16% in the last 90 days.
With that in mind, it's worth seeing if the company's underlying fundamentals have been the driver of long term performance, or if there are some discrepancies.
View our latest analysis for Integrated Research
There is no denying that markets are sometimes efficient, but prices do not always reflect underlying business performance. One imperfect but simple way to consider how the market perception of a company has shifted is to compare the change in the earnings per share (EPS) with the share price movement.
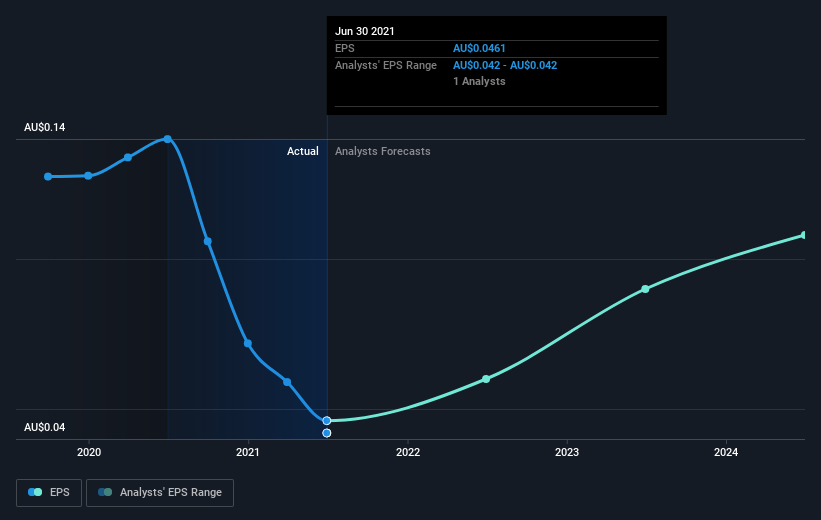
Unhappily, Integrated Research had to report a 67% decline in EPS over the last year. This proportional reduction in earnings per share isn't far from the 56% decrease in the share price. Given the lower EPS we might have expected investors to lose confidence in the stock, but that doesn't seemed to have happened. Rather, the share price is remains a similar multiple of the EPS, suggesting the outlook remains the same.
You can see how EPS has changed over time in the image below (click on the chart to see the exact values).
We consider it positive that insiders have made significant purchases in the last year. Having said that, most people consider earnings and revenue growth trends to be a more meaningful guide to the business. It might be well worthwhile taking a look at our free report on Integrated Research's earnings, revenue and cash flow.
A Different Perspective
Integrated Research shareholders are down 56% for the year, but the market itself is up 26%. However, keep in mind that even the best stocks will sometimes underperform the market over a twelve month period. Regrettably, last year's performance caps off a bad run, with the shareholders facing a total loss of 4% per year over five years. We realise that Baron Rothschild has said investors should "buy when there is blood on the streets", but we caution that investors should first be sure they are buying a high quality business. It's always interesting to track share price performance over the longer term. But to understand Integrated Research better, we need to consider many other factors. Take risks, for example - Integrated Research has 2 warning signs we think you should be aware of.
If you like to buy stocks alongside management, then you might just love this free list of companies. (Hint: insiders have been buying them).
Please note, the market returns quoted in this article reflect the market weighted average returns of stocks that currently trade on AU exchanges.
This article by Simply Wall St is general in nature. We provide commentary based on historical data and analyst forecasts only using an unbiased methodology and our articles are not intended to be financial advice. It does not constitute a recommendation to buy or sell any stock, and does not take account of your objectives, or your financial situation. We aim to bring you long-term focused analysis driven by fundamental data. Note that our analysis may not factor in the latest price-sensitive company announcements or qualitative material. Simply Wall St has no position in any stocks mentioned.
Have feedback on this article? Concerned about the content? Get in touch with us directly. Alternatively, email editorial-team (at) simplywallst.com.