
 Yahoo Finance
 Interactive Brokers (IBKR) Q4 Earnings Flat Y/Y, Revenues Up
Interactive Brokers Group IBKR recorded fourth-quarter 2019 adjusted earnings per share of 58 cents. The figure matched the prior-year quarter’s earnings.
Results excluded certain non-recurring items. After considering these, net income came in at $294 million or 57 cents per share compared with $290 million or 57 cents per share in the prior-year quarter.
Results were impacted by escalating non-interest expenses and fall in daily average revenue trades (DARTs). Also, the company’s segmental net revenues failed to impress. However, rise in revenues acted as a tailwind.
Interactive Brokers reported comprehensive income available to common shareholders of $51 million or 66 cents per share, up from $43 million or 56 cents per share in the prior-year quarter.
For 2019, earnings were $2.10 per share compared with the prior-year figure of $2.28. Net income decreased 3.2% to $1.1 billion.
Revenues Rise & Expenses Up
Total net revenues were $500 million, up 1.6% year over year. The rise was driven by higher interest income and stable trading gains, which were partially offset by decline in commissions.
For 2019, total net revenues of $1.9 billion increased 1.8% year over year.
Total non-interest expenses increased 2.7% from the year-ago quarter to $188 million. Rise in all expense components except for execution, clearing and distribution fees were the reasons behind this increase.
Income before income taxes was $312 million, up 1% from the prior-year quarter. Pre-tax profit margin was 62%, down from 63% a year ago.
Quarterly Segmental Performance
Electronic Brokerage: Net revenues decreased nearly 1% year over year to $486 million. However, pre-tax income rose 1% to $314 million. Total DARTs for cleared and execution-only customers were 797,000, down 16% from the year-ago quarter. Pre-tax profit margin was 65%, up from 63%.
Market Making: Net revenues were $15 million, down 11.8% from the prior-year quarter. Pre-tax income was $5 million, down 44.4%. Pre-tax profit margin was 33% compared with 53% in the year-ago quarter.
Corporate: It reported negative net revenues of $1 million compared with negative revenues of $15 million in the year-ago quarter. Pre-tax loss was $7 million compared with loss of $11 million a year ago.
Strong Capital Position
As of Dec 31, 2019, cash and cash equivalents (including cash and securities set aside for regulatory purposes) totaled $30.1 billion compared with $25.7 billion as of Dec 31, 2018.
As of Dec 31, 2019, total assets were $71.7 billion compared with $60.5 billion on Dec 31, 2018. Total equity was $7.9 billion compared with $7.2 billion at the end of December 2018.
Our Take
Higher expenses and decline in daily average revenue trades witnessed in the quarter pose major concerns for Interactive Brokers. However, the firm remains well poised to capitalize on growth prospects, backed by its efforts to explore emerging markets. Also, the company’s launch of IBKR Lite service is likely to support its financials at a time when significant volatility in the markets is hurting the brokerage industry.
Interactive Brokers Group, Inc. Price, Consensus and EPS Surprise
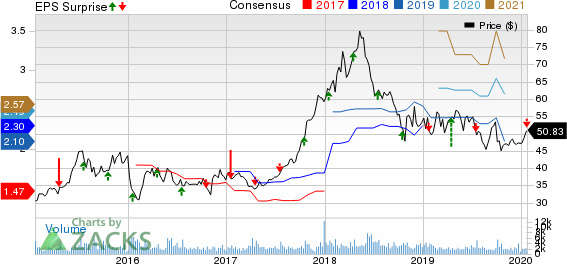
Interactive Brokers Group, Inc. price-consensus-eps-surprise-chart | Interactive Brokers Group, Inc. Quote
Currently, Interactive Brokers carries a Zacks Rank #3 (Hold). You can see the complete list of today’s Zacks #1 Rank (Strong Buy) stocks here.
Performance and Upcoming Releases of Other Investment Brokers
Charles Schwab’s SCHW fourth-quarter 2019 adjusted earnings of 63 cents per share lagged the Zacks Consensus Estimate by a penny. Also, the bottom line decreased 3% from the prior-year quarter. Results for the reported quarter excluded $25 million (1 cent per share) expenses relating to two pending acquisitions.
E*TRADE Financial ETFC is scheduled to announce the results on Jan 23.
T. Rowe Price Group, Inc. TROW is slated to report on Jan 29.
Just Released: Zacks’ 7 Best Stocks for Today
Experts extracted 7 stocks from the list of 220 Zacks Rank #1 Strong Buys that has beaten the market more than 2X over with a stunning average gain of +24.6% per year.
These 7 were selected because of their superior potential for immediate breakout.
See these time-sensitive tickers now >>
Want the latest recommendations from Zacks Investment Research? Today, you can download 7 Best Stocks for the Next 30 Days. Click to get this free report
Interactive Brokers Group, Inc. (IBKR) : Free Stock Analysis Report
E*TRADE Financial Corporation (ETFC) : Free Stock Analysis Report
The Charles Schwab Corporation (SCHW) : Free Stock Analysis Report
T. Rowe Price Group, Inc. (TROW) : Free Stock Analysis Report
To read this article on Zacks.com click here.
Zacks Investment Research
