
 Yahoo Finance
 Interested In Lumibird (EPA:LBIRD)? Here’s What Its Recent Performance Looks Like

After looking at Lumibird’s (EPA:LBIRD) latest earnings announcement (31 December 2017), I found it useful to revisit the company’s performance in the past couple of years and assess this against the most recent figures. As a long-term investor I tend to focus on earnings trend, rather than a single number at one point in time. Also, comparing it against an industry benchmark to understand whether it outperformed, or is simply riding an industry wave, is a crucial aspect. Below is a brief commentary on my key takeaways. View out our latest analysis for Lumibird
Did LBIRD’s recent earnings growth beat the long-term trend and the industry?
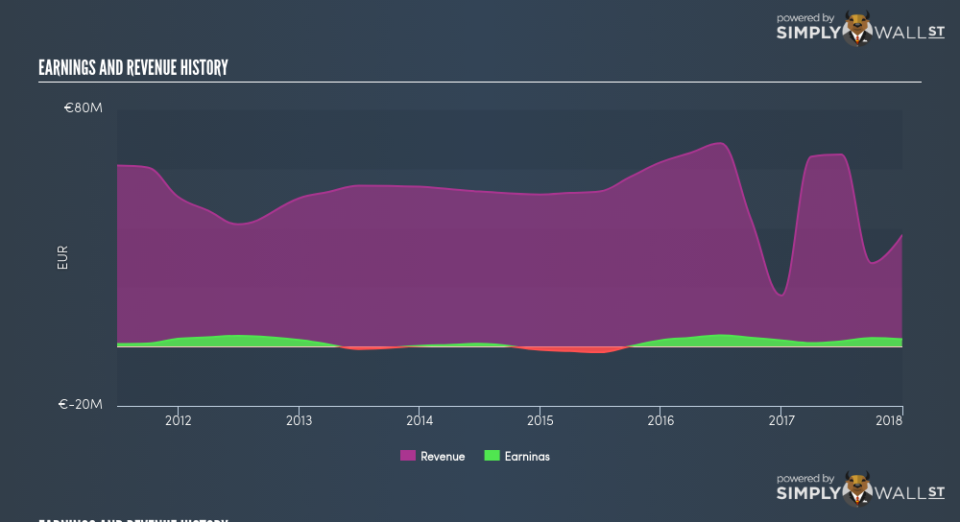
LBIRD’s trailing twelve-month earnings (from 31 December 2017) of €2.52m has jumped 18.41% compared to the previous year. Furthermore, this one-year growth rate has exceeded its 5-year annual growth average of 4.82%, indicating the rate at which LBIRD is growing has accelerated. What’s enabled this growth? Well, let’s take a look at whether it is merely because of an industry uplift, or if Lumibird has experienced some company-specific growth.
Over the past couple of years, Lumibird expanded bottom-line, while its top-line fell, by efficiently controlling its costs. This resulted in to a margin expansion and profitability over time. Looking at growth from a sector-level, the FR electronic industry has been relatively flat in terms of earnings growth over the last few years. This means that whatever recent headwind the industry is experiencing, Lumibird is relatively better-cushioned than its peers.
In terms of returns from investment, Lumibird has not invested its equity funds well, leading to a 3.32% return on equity (ROE), below the sensible minimum of 20%. Furthermore, its return on assets (ROA) of 2.31% is below the FR Electronic industry of 4.25%, indicating Lumibird’s are utilized less efficiently. However, its return on capital (ROC), which also accounts for Lumibird’s debt level, has increased over the past 3 years from -3.66% to 4.64%. This correlates with a decrease in debt holding, with debt-to-equity ratio declining from 133.56% to 27.32% over the past 5 years.
What does this mean?
Lumibird’s track record can be a valuable insight into its earnings performance, but it certainly doesn’t tell the whole story. Positive growth and profitability are what investors like to see in a company’s track record, but how do we properly assess sustainability? I recommend you continue to research Lumibird to get a better picture of the stock by looking at:
Future Outlook: What are well-informed industry analysts predicting for LBIRD’s future growth? Take a look at our free research report of analyst consensus for LBIRD’s outlook.
Financial Health: Is LBIRD’s operations financially sustainable? Balance sheets can be hard to analyze, which is why we’ve done it for you. Check out our financial health checks here.
Other High-Performing Stocks: Are there other stocks that provide better prospects with proven track records? Explore our free list of these great stocks here.
NB: Figures in this article are calculated using data from the trailing twelve months from 31 December 2017. This may not be consistent with full year annual report figures.
To help readers see pass the short term volatility of the financial market, we aim to bring you a long-term focused research analysis purely driven by fundamental data. Note that our analysis does not factor in the latest price sensitive company announcements.
The author is an independent contributor and at the time of publication had no position in the stocks mentioned.
