
 Yahoo Finance
 Interested In Ocean Power Technologies Inc (NASDAQ:OPTT)? Here’s How It Performed Recently

When Ocean Power Technologies Inc (NASDAQ:OPTT) released its most recent earnings update (31 January 2018), I compared it against two factor: its historical earnings track record, and the performance of its industry peers on average. Being able to interpret how well Ocean Power Technologies has done so far requires weighing its performance against a benchmark, rather than looking at a standalone number at a point in time. In this article, I’ve summarized the key takeaways on how I see OPTT has performed. Check out our latest analysis for Ocean Power Technologies
How OPTT fared against its long-term earnings performance and its industry
For the purpose of this commentary, I like to use the ‘latest twelve-month’ data, which annualizes the latest 6-month earnings release, or some times, the latest annual report is already the most recent financial data. This technique allows me to analyze many different companies on a more comparable basis, using the latest information. For Ocean Power Technologies, its latest earnings (trailing twelve month) is -US$9.48M, which, against the prior year’s figure, has become less negative. Since these values are somewhat myopic, I’ve calculated an annualized five-year figure for OPTT’s net income, which stands at -US$12.93M. This shows that, even though net income is negative, it has become less negative over the years.
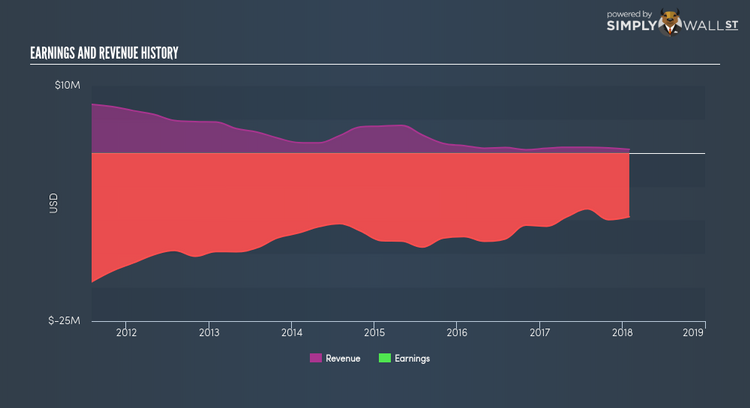
We can further evaluate Ocean Power Technologies’s loss by looking at what the industry has been experiencing over the past few years. Each year, for the past half a decade Ocean Power Technologies has seen an annual decline in revenue of -32.90%, on average. This adverse movement is a driver of the company’s inability to reach breakeven. Has the entire industry experienced this headwind? Inspecting growth from a sector-level, the US electrical industry has been growing, albeit, at a unexciting single-digit rate of 8.20% in the past year, and a substantial 13.48% over the past five. This shows that, despite the fact that Ocean Power Technologies is presently unprofitable, it may have benefited from industry tailwinds, moving earnings in the right direction.
What does this mean?
While past data is useful, it doesn’t tell the whole story. With companies that are currently loss-making, it is always difficult to predict what will happen in the future and when. The most insightful step is to examine company-specific issues Ocean Power Technologies may be facing and whether management guidance has steadily been met in the past. I suggest you continue to research Ocean Power Technologies to get a more holistic view of the stock by looking at:
Financial Health: Is OPTT’s operations financially sustainable? Balance sheets can be hard to analyze, which is why we’ve done it for you. Check out our financial health checks here.
Other High-Performing Stocks: Are there other stocks that provide better prospects with proven track records? Explore our free list of these great stocks here.
NB: Figures in this article are calculated using data from the trailing twelve months from 31 January 2018. This may not be consistent with full year annual report figures.
To help readers see pass the short term volatility of the financial market, we aim to bring you a long-term focused research analysis purely driven by fundamental data. Note that our analysis does not factor in the latest price sensitive company announcements.
The author is an independent contributor and at the time of publication had no position in the stocks mentioned.
