
 Yahoo Finance
 Interested In ORPEA Société Anonyme (EPA:ORP)? Here’s How It Performed Recently

Examining ORPEA Société Anonyme’s (ENXTPA:ORP) past track record of performance is an insightful exercise for investors. It allows us to reflect on whether or not the company has met or exceed expectations, which is a great indicator for future performance. Today I will assess ORP’s latest performance announced on 31 December 2017 and compare these figures to its longer term trend and industry movements. View our latest analysis for ORPEA Société Anonyme
Did ORP perform worse than its track record and industry?
I use data from the most recent 12 months, which either annualizes the most recent 6-month earnings update, or in some cases, the most recent annual report is already the latest available financial data. This enables me to examine many different companies on a more comparable basis, using the latest information. For ORPEA Société Anonyme, its latest earnings (trailing twelve month) is €89.79M, which, in comparison to the prior year’s level, has taken a dive by a significant -69.41%. Given that these figures may be fairly short-term thinking, I have estimated an annualized five-year figure for ORPEA Société Anonyme’s earnings, which stands at €123.57M This doesn’t look much better, since earnings seem to have steadily been diminishing over time.
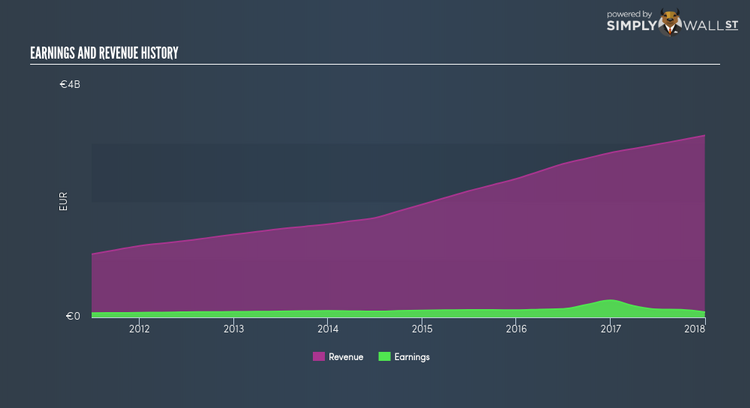
Why is this? Let’s examine what’s occurring with margins and if the rest of the industry is experiencing the hit as well. Revenue growth in the past couple of years, has been positive, however, earnings growth has not been able to catch up, meaning ORPEA Société Anonyme has been ramping up its expenses by a lot more. This harms margins and earnings, and is not a sustainable practice. Scanning growth from a sector-level, the FR healthcare industry has been enduring some headwinds in the past year, leading to an average earnings drop of -22.54%. This is a significant change, given that the industry has constantly been delivering a a robust growth of 12.53% in the previous five years. This shows that any near-term headwind the industry is experiencing, it’s hitting ORPEA Société Anonyme harder than its peers.
What does this mean?
While past data is useful, it doesn’t tell the whole story. Typically companies that experience an extended period of decline in earnings are going through some sort of reinvestment phase However, if the whole industry is struggling to grow over time, it may be a signal of a structural shift, which makes ORPEA Société Anonyme and its peers a riskier investment. I recommend you continue to research ORPEA Société Anonyme to get a more holistic view of the stock by looking at:
Future Outlook: What are well-informed industry analysts predicting for ORP’s future growth? Take a look at our free research report of analyst consensus for ORP’s outlook.
Financial Health: Is ORP’s operations financially sustainable? Balance sheets can be hard to analyze, which is why we’ve done it for you. Check out our financial health checks here.
Other High-Performing Stocks: Are there other stocks that provide better prospects with proven track records? Explore our free list of these great stocks here.
NB: Figures in this article are calculated using data from the trailing twelve months from 31 December 2017. This may not be consistent with full year annual report figures.
To help readers see pass the short term volatility of the financial market, we aim to bring you a long-term focused research analysis purely driven by fundamental data. Note that our analysis does not factor in the latest price sensitive company announcements.
The author is an independent contributor and at the time of publication had no position in the stocks mentioned.
