
 Yahoo Finance
 Interested In The Procter & Gamble Company (NYSE:PG)? Here’s How It Performed Recently

For investors with a long-term horizon, assessing earnings trend over time and against industry benchmarks is more valuable than looking at a single earnings announcement in one point in time. Investors may find my commentary, albeit very high-level and brief, on The Procter & Gamble Company (NYSE:PG) useful as an attempt to give more color around how Procter & Gamble is currently performing. View our latest analysis for Procter & Gamble
Did PG’s recent performance beat its trend and industry?
I look at the ‘latest twelve-month’ data, which annualizes the most recent half-year data, or in some cases, the latest annual report is already the most recent financial year data. This blend enables me to examine different companies on a more comparable basis, using the most relevant data points. For Procter & Gamble, its most recent trailing-twelve-month earnings is US$9.81B, which, in comparison to last year’s level, Since these values may be relatively short-term thinking, I’ve computed an annualized five-year value for PG’s earnings, which stands at US$9.81B This means that, on average, Procter & Gamble has been able to increase its earnings over the past few years.
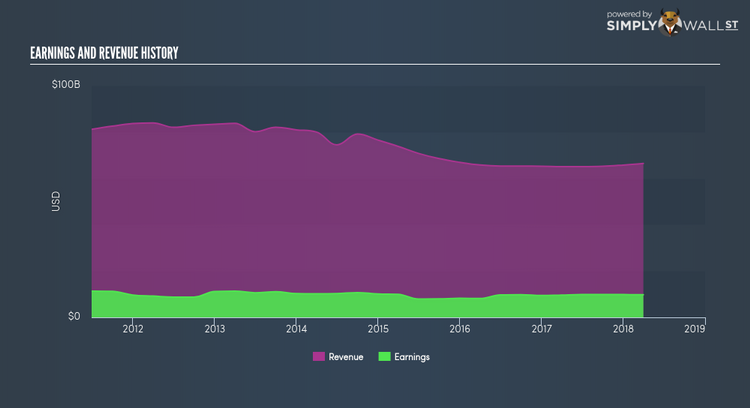
How has it been able to do this? Let’s see if it is solely attributable to industry tailwinds, or if Procter & Gamble has seen some company-specific growth. In the past couple of years, though bottom-line growth has seen a decrease, top-line growth has dropped by a lot more, causing a margin expansion and Procter & Gamble still maintaining profitability. Inspecting growth from a sector-level, the US household products industry has been growing its average earnings by double-digit 17.28% over the prior year, and a less exciting 9.58% over the last five years. This means whatever tailwind the industry is deriving benefit from, Procter & Gamble has not been able to realize the gains unlike its industry peers.
What does this mean?
While past data is useful, it doesn’t tell the whole story. While Procter & Gamble has a good historical track record with positive growth and profitability, there’s no certainty that this will extrapolate into the future. You should continue to research Procter & Gamble to get a better picture of the stock by looking at:
Future Outlook: What are well-informed industry analysts predicting for PG’s future growth? Take a look at our free research report of analyst consensus for PG’s outlook.
Financial Health: Is PG’s operations financially sustainable? Balance sheets can be hard to analyze, which is why we’ve done it for you. Check out our financial health checks here.
Other High-Performing Stocks: Are there other stocks that provide better prospects with proven track records? Explore our free list of these great stocks here.
NB: Figures in this article are calculated using data from the trailing twelve months from 31 March 2018. This may not be consistent with full year annual report figures.
To help readers see pass the short term volatility of the financial market, we aim to bring you a long-term focused research analysis purely driven by fundamental data. Note that our analysis does not factor in the latest price sensitive company announcements.
The author is an independent contributor and at the time of publication had no position in the stocks mentioned.
