
 Yahoo Finance
 Interested In Tuesday Morning Corporation (NASDAQ:TUES)? Here’s How It Performed Recently

Examining Tuesday Morning Corporation’s (NASDAQ:TUES) past track record of performance is an insightful exercise for investors. It allows us to reflect on whether or not the company has met or exceed expectations, which is a great indicator for future performance. Today I will assess TUES’s latest performance announced on 31 March 2018 and compare these figures to its longer term trend and industry movements. View our latest analysis for Tuesday Morning
How Did TUES’s Recent Performance Stack Up Against Its Past?
I like to use data from the most recent 12 months, which either annualizes the most recent 6-month earnings update, or in some cases, the most recent annual report is already the latest available financial data. This blend allows me to analyze different stocks on a more comparable basis, using the most relevant data points. For Tuesday Morning, its latest trailing-twelve-month earnings is -US$28.96M, which, against last year’s figure, has become more negative. Since these values may be somewhat short-term thinking, I have calculated an annualized five-year value for Tuesday Morning’s earnings, which stands at -US$12.04M. This doesn’t seem to paint a better picture, as earnings seem to have consistently been getting more and more negative over time.
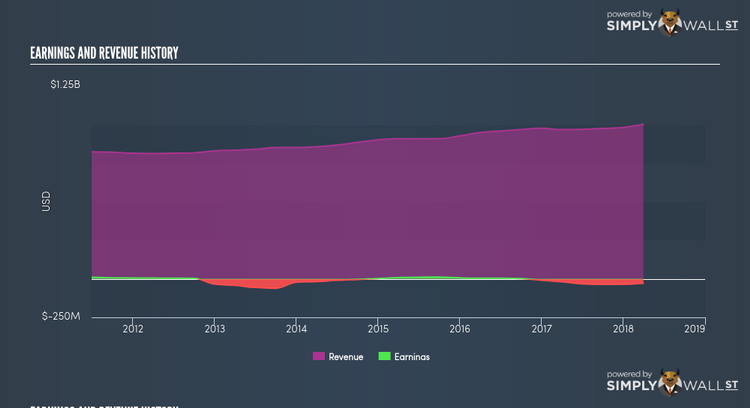
We can further examine Tuesday Morning’s loss by looking at what the industry has been experiencing over the past few years. Each year, for the last five years Tuesday Morning’s top-line has risen by a mere 3.41%, on average. The company’s inability to breakeven has been aided by the relatively flat top-line in the past. Inspecting growth from a sector-level, the US multiline retail industry has been growing its average earnings by double-digit 16.58% in the previous year, and a less exciting 6.34% over the past half a decade. This means whatever uplift the industry is profiting from, Tuesday Morning has not been able to leverage it as much as its average peer.
What does this mean?
While past data is useful, it doesn’t tell the whole story. Companies that incur net loss is always difficult to forecast what will occur going forward, and when. The most insightful step is to examine company-specific issues Tuesday Morning may be facing and whether management guidance has steadily been met in the past. I recommend you continue to research Tuesday Morning to get a more holistic view of the stock by looking at:
Future Outlook: What are well-informed industry analysts predicting for TUES’s future growth? Take a look at our free research report of analyst consensus for TUES’s outlook.
Financial Health: Is TUES’s operations financially sustainable? Balance sheets can be hard to analyze, which is why we’ve done it for you. Check out our financial health checks here.
Other High-Performing Stocks: Are there other stocks that provide better prospects with proven track records? Explore our free list of these great stocks here.
NB: Figures in this article are calculated using data from the trailing twelve months from 31 March 2018. This may not be consistent with full year annual report figures.
To help readers see pass the short term volatility of the financial market, we aim to bring you a long-term focused research analysis purely driven by fundamental data. Note that our analysis does not factor in the latest price sensitive company announcements.
The author is an independent contributor and at the time of publication had no position in the stocks mentioned.
