
 Yahoo Finance
 Do You Like The InterGroup Corporation (NASDAQ:INTG) At This P/E Ratio?

InterGroup (NASDAQ:INTG) shares have retraced a considerable in the last month, but the stock is still up slightly on where it started the quarter. The stock has been solid, longer term, gaining 15% in the last year.
Assuming no other changes, a sharply higher share price makes a stock less attractive to potential buyers. In the long term, share prices tend to follow earnings per share, but in the short term prices bounce around in response to short term factors (which are not always obvious). The implication here is that deep value investors might steer clear when expectations of a company are too high. One way to gauge market expectations of a stock is to look at its Price to Earnings Ratio (PE Ratio). A high P/E implies that investors have high expectations of what a company can achieve compared to a company with a low P/E ratio.
Check out our latest analysis for InterGroup
How Does InterGroup's P/E Ratio Compare To Its Peers?
We can tell from its P/E ratio of 34.21 that there is some investor optimism about InterGroup. As you can see below, InterGroup has a higher P/E than the average company (23.5) in the real estate industry.
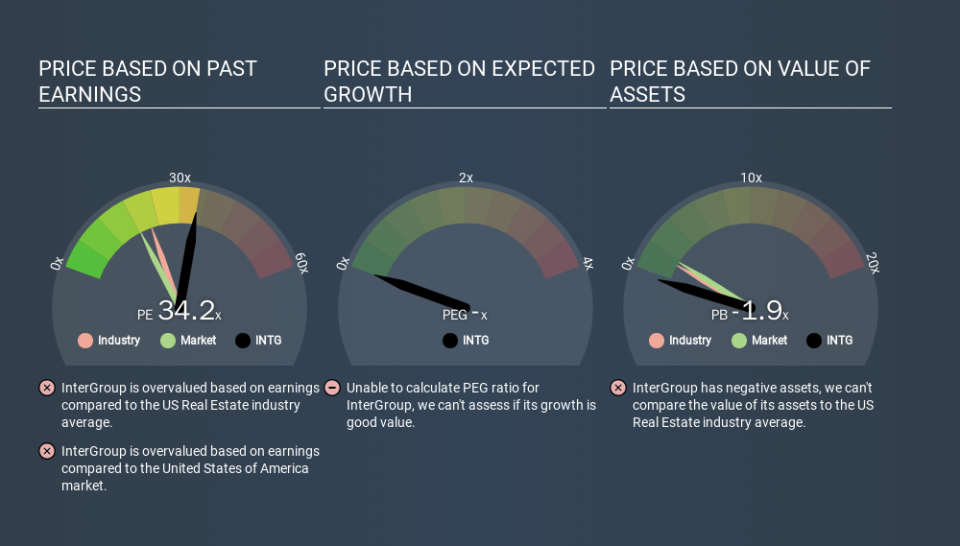
Its relatively high P/E ratio indicates that InterGroup shareholders think it will perform better than other companies in its industry classification. Shareholders are clearly optimistic, but the future is always uncertain. So investors should delve deeper. I like to check if company insiders have been buying or selling.
How Growth Rates Impact P/E Ratios
Generally speaking the rate of earnings growth has a profound impact on a company's P/E multiple. If earnings are growing quickly, then the 'E' in the equation will increase faster than it would otherwise. Therefore, even if you pay a high multiple of earnings now, that multiple will become lower in the future. So while a stock may look expensive based on past earnings, it could be cheap based on future earnings.
InterGroup's earnings per share fell by 54% in the last twelve months.
Don't Forget: The P/E Does Not Account For Debt or Bank Deposits
One drawback of using a P/E ratio is that it considers market capitalization, but not the balance sheet. That means it doesn't take debt or cash into account. The exact same company would hypothetically deserve a higher P/E ratio if it had a strong balance sheet, than if it had a weak one with lots of debt, because a cashed up company can spend on growth.
While growth expenditure doesn't always pay off, the point is that it is a good option to have; but one that the P/E ratio ignores.
InterGroup's Balance Sheet
InterGroup's net debt is considerable, at 195% of its market cap. If you want to compare its P/E ratio to other companies, you must keep in mind that these debt levels would usually warrant a relatively low P/E.
The Verdict On InterGroup's P/E Ratio
InterGroup's P/E is 34.2 which is above average (18.5) in its market. With significant debt and no EPS growth last year, shareholders are betting on an improvement in earnings from the company. What can be absolutely certain is that the market has become less optimistic about InterGroup over the last month, with the P/E ratio falling from 34.2 back then to 34.2 today. For those who prefer to invest with the flow of momentum, that might be a bad sign, but for a contrarian, it may signal opportunity.
When the market is wrong about a stock, it gives savvy investors an opportunity. People often underestimate remarkable growth -- so investors can make money when fast growth is not fully appreciated. Although we don't have analyst forecasts you could get a better understanding of its growth by checking out this more detailed historical graph of earnings, revenue and cash flow.
But note: InterGroup may not be the best stock to buy. So take a peek at this free list of interesting companies with strong recent earnings growth (and a P/E ratio below 20).
If you spot an error that warrants correction, please contact the editor at editorial-team@simplywallst.com. This article by Simply Wall St is general in nature. It does not constitute a recommendation to buy or sell any stock, and does not take account of your objectives, or your financial situation. Simply Wall St has no position in the stocks mentioned.
We aim to bring you long-term focused research analysis driven by fundamental data. Note that our analysis may not factor in the latest price-sensitive company announcements or qualitative material. Thank you for reading.
