
 Yahoo Finance
 Is The Interpublic Group of Companies, Inc.'s (NYSE:IPG) CEO Salary Justified?

In 2005 Michael Roth was appointed CEO of The Interpublic Group of Companies, Inc. (NYSE:IPG). This report will, first, examine the CEO compensation levels in comparison to CEO compensation at companies of similar size. After that, we will consider the growth in the business. And finally we will reflect on how common stockholders have fared in the last few years, as a secondary measure of performance. This process should give us an idea about how appropriately the CEO is paid.
See our latest analysis for Interpublic Group of Companies
How Does Michael Roth's Compensation Compare With Similar Sized Companies?
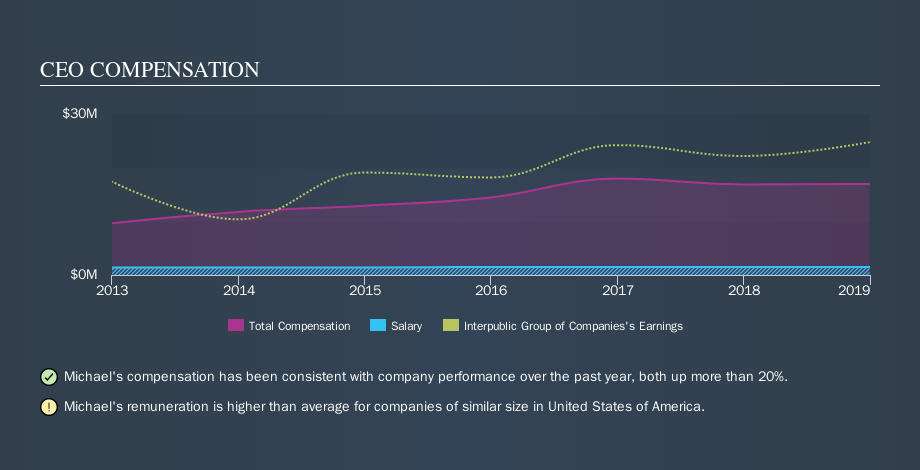
According to our data, The Interpublic Group of Companies, Inc. has a market capitalization of US$8.3b, and paid its CEO total annual compensation worth US$17m over the year to December 2018. While this analysis focuses on total compensation, it's worth noting the salary is lower, valued at US$1.5m. We note that more than half of the total compensation is not the salary; and performance requirements may apply to this non-salary portion. When we examined a selection of companies with market caps ranging from US$4.0b to US$12b, we found the median CEO total compensation was US$6.8m.
As you can see, Michael Roth is paid more than the median CEO pay at companies of a similar size, in the same market. However, this does not necessarily mean The Interpublic Group of Companies, Inc. is paying too much. A closer look at the performance of the underlying business will give us a better idea about whether the pay is particularly generous.
You can see a visual representation of the CEO compensation at Interpublic Group of Companies, below.
Is The Interpublic Group of Companies, Inc. Growing?
On average over the last three years, The Interpublic Group of Companies, Inc. has grown earnings per share (EPS) by 5.3% each year (using a line of best fit). In the last year, its revenue is up 9.8%.
I would argue that the improvement in revenue isn't particularly impressive, but I'm happy with the modest EPS growth. Considering these factors I'd say performance has been pretty decent, though not amazing. Shareholders might be interested in this free visualization of analyst forecasts.
Has The Interpublic Group of Companies, Inc. Been A Good Investment?
With a total shareholder return of 6.7% over three years, The Interpublic Group of Companies, Inc. has done okay by shareholders. But they probably wouldn't be so happy as to think the CEO should be paid more than is normal, for companies around this size.
In Summary...
We examined the amount The Interpublic Group of Companies, Inc. pays its CEO, and compared it to the amount paid by similar sized companies. Our data suggests that it pays above the median CEO pay within that group.
We generally prefer to see stronger EPS growth, and we're not particularly impressed with the total shareholder return, over the last three years. In conclusion we think the company should definitely focus on improving the business before awarding any large pay rises. CEO compensation is one thing, but it is also interesting to check if the CEO is buying or selling Interpublic Group of Companies (free visualization of insider trades).
Arguably, business quality is much more important than CEO compensation levels. So check out this free list of interesting companies, that have HIGH return on equity and low debt.
We aim to bring you long-term focused research analysis driven by fundamental data. Note that our analysis may not factor in the latest price-sensitive company announcements or qualitative material.
If you spot an error that warrants correction, please contact the editor at editorial-team@simplywallst.com. This article by Simply Wall St is general in nature. It does not constitute a recommendation to buy or sell any stock, and does not take account of your objectives, or your financial situation. Simply Wall St has no position in the stocks mentioned. Thank you for reading.
