
 Yahoo Finance
 InTiCa Systems (ETR:IS7) Might Be Having Difficulty Using Its Capital Effectively
There are a few key trends to look for if we want to identify the next multi-bagger. One common approach is to try and find a company with returns on capital employed (ROCE) that are increasing, in conjunction with a growing amount of capital employed. If you see this, it typically means it's a company with a great business model and plenty of profitable reinvestment opportunities. Although, when we looked at InTiCa Systems (ETR:IS7), it didn't seem to tick all of these boxes.
What Is Return On Capital Employed (ROCE)?
For those that aren't sure what ROCE is, it measures the amount of pre-tax profits a company can generate from the capital employed in its business. Analysts use this formula to calculate it for InTiCa Systems:
Return on Capital Employed = Earnings Before Interest and Tax (EBIT) ÷ (Total Assets - Current Liabilities)
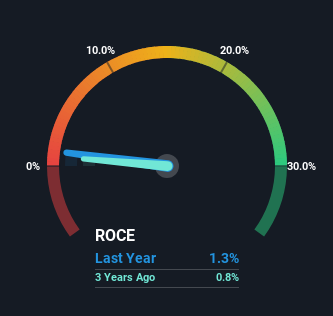
0.013 = €514k ÷ (€69m - €28m) (Based on the trailing twelve months to June 2023).
Thus, InTiCa Systems has an ROCE of 1.3%. Ultimately, that's a low return and it under-performs the Electronic industry average of 9.8%.
See our latest analysis for InTiCa Systems
In the above chart we have measured InTiCa Systems' prior ROCE against its prior performance, but the future is arguably more important. If you'd like, you can check out the forecasts from the analysts covering InTiCa Systems here for free.
So How Is InTiCa Systems' ROCE Trending?
On the surface, the trend of ROCE at InTiCa Systems doesn't inspire confidence. Over the last five years, returns on capital have decreased to 1.3% from 3.0% five years ago. However it looks like InTiCa Systems might be reinvesting for long term growth because while capital employed has increased, the company's sales haven't changed much in the last 12 months. It may take some time before the company starts to see any change in earnings from these investments.
On a separate but related note, it's important to know that InTiCa Systems has a current liabilities to total assets ratio of 41%, which we'd consider pretty high. This can bring about some risks because the company is basically operating with a rather large reliance on its suppliers or other sorts of short-term creditors. Ideally we'd like to see this reduce as that would mean fewer obligations bearing risks.
The Bottom Line
In summary, InTiCa Systems is reinvesting funds back into the business for growth but unfortunately it looks like sales haven't increased much just yet. Additionally, the stock's total return to shareholders over the last five years has been flat, which isn't too surprising. On the whole, we aren't too inspired by the underlying trends and we think there may be better chances of finding a multi-bagger elsewhere.
InTiCa Systems does come with some risks though, we found 3 warning signs in our investment analysis, and 1 of those can't be ignored...
For those who like to invest in solid companies, check out this free list of companies with solid balance sheets and high returns on equity.
Have feedback on this article? Concerned about the content? Get in touch with us directly. Alternatively, email editorial-team (at) simplywallst.com.
This article by Simply Wall St is general in nature. We provide commentary based on historical data and analyst forecasts only using an unbiased methodology and our articles are not intended to be financial advice. It does not constitute a recommendation to buy or sell any stock, and does not take account of your objectives, or your financial situation. We aim to bring you long-term focused analysis driven by fundamental data. Note that our analysis may not factor in the latest price-sensitive company announcements or qualitative material. Simply Wall St has no position in any stocks mentioned.
