
 Yahoo Finance
 Intrinsic Calculation For Sanne Group plc (LON:SNN) Shows Investors Are Overpaying

Want to participate in a short research study? Help shape the future of investing tools and you could win a $250 gift card!
Valuing SNN, a financial stock, can be daunting since these capital market firms generally have cash flows that are impacted by regulations that are not imposed upon other industries. For example, capital market businesses are required to hold more capital to reduce the risk to shareholders. Focusing on line items such as book values, as well as the return and cost of equity, can be appropriate for assessing SNN’s intrinsic value. Today I’ll determine how to value SNN in a relatively useful and simple method.
See our latest analysis for Sanne Group
Why Excess Return Model?
Financial firms differ to other sector firms primarily because of the kind of regulation they face and their asset composition. The regulatory environment in Jersey is fairly rigorous. In addition to this, capital markets tend to not have substantial amounts of physical assets on their balance sheet. While traditional DCF models emphasize on inputs such as capital expenditure and depreciation, which is less useful for a financial stock, the Excess Return model focuses on book values and stable earnings.
Deriving SNN’s True Value
The central belief for Excess Returns is, the value of the company is how much money it can generate from its current level of equity capital, in excess of the cost of that capital. The returns in excess of cost of equity is called excess returns:
Excess Return Per Share = (Stable Return On Equity – Cost Of Equity) (Book Value Of Equity Per Share)
= (0.26% – 8.2%) x £1.36 = £0.24
Excess Return Per Share is used to calculate the terminal value of SNN, which is how much the business is expected to continue to generate over the upcoming years, in perpetuity. This is a common component of discounted cash flow models:
Terminal Value Per Share = Excess Return Per Share / (Cost of Equity – Expected Growth Rate)
= £0.24 / (8.2% – 1.2%) = £3.43
These factors are combined to calculate the true value of SNN’s stock:
Value Per Share = Book Value of Equity Per Share + Terminal Value Per Share
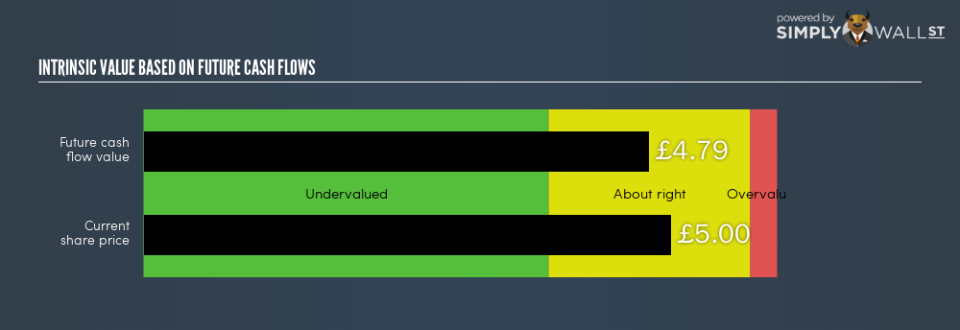
= £1.36 + £3.43 = £4.79
This results in an intrinsic value of £4.79. Compared to the current share price of UK£5.00, SNN is , at this time, fairly priced by the market. This means SNN isn’t an attractive buy right now. Valuation is only one part of your investment analysis for whether to buy or sell SNN. Fundamental factors are key to determining if SNN fits with the rest of your portfolio holdings.
Next Steps:
For capital markets, there are three key aspects you should look at:
Financial health: Does it have a healthy balance sheet? Take a look at our free bank analysis with six simple checks on things like leverage and risk.
Future earnings: What does the market think of SNN going forward? Our analyst growth expectation chart helps visualize SNN’s growth potential over the upcoming years.
Dividends: Most people buy financial stocks for their healthy and stable dividends. Check out whether SNN is a dividend Rockstar with our historical and future dividend analysis.
For more details and sources, take a look at our full calculation on SNN here.
To help readers see past the short term volatility of the financial market, we aim to bring you a long-term focused research analysis purely driven by fundamental data. Note that our analysis does not factor in the latest price-sensitive company announcements.
The author is an independent contributor and at the time of publication had no position in the stocks mentioned. For errors that warrant correction please contact the editor at editorial-team@simplywallst.com.