
 Yahoo Finance
 An Intrinsic Calculation For Turtle Beach Corporation (NASDAQ:HEAR) Suggests It's 49% Undervalued
Key Insights
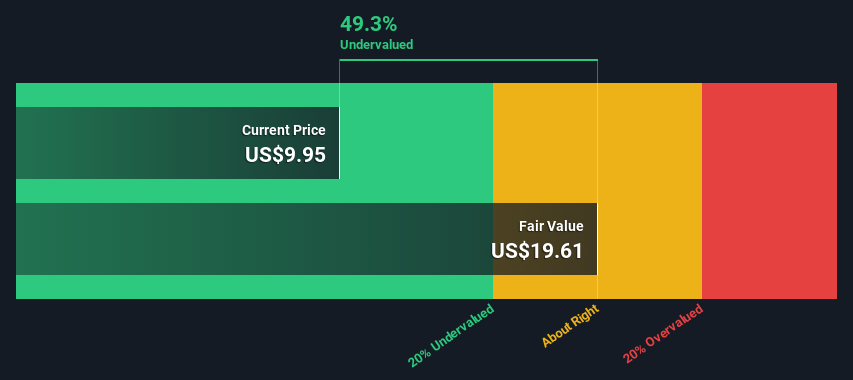
Turtle Beach's estimated fair value is US$19.61 based on 2 Stage Free Cash Flow to Equity
Current share price of US$9.95 suggests Turtle Beach is potentially 49% undervalued
Our fair value estimate is 27% higher than Turtle Beach's analyst price target of US$15.40
Today we'll do a simple run through of a valuation method used to estimate the attractiveness of Turtle Beach Corporation (NASDAQ:HEAR) as an investment opportunity by projecting its future cash flows and then discounting them to today's value. Our analysis will employ the Discounted Cash Flow (DCF) model. It may sound complicated, but actually it is quite simple!
We would caution that there are many ways of valuing a company and, like the DCF, each technique has advantages and disadvantages in certain scenarios. If you still have some burning questions about this type of valuation, take a look at the Simply Wall St analysis model.
Check out our latest analysis for Turtle Beach
The Model
We use what is known as a 2-stage model, which simply means we have two different periods of growth rates for the company's cash flows. Generally the first stage is higher growth, and the second stage is a lower growth phase. To start off with, we need to estimate the next ten years of cash flows. Where possible we use analyst estimates, but when these aren't available we extrapolate the previous free cash flow (FCF) from the last estimate or reported value. We assume companies with shrinking free cash flow will slow their rate of shrinkage, and that companies with growing free cash flow will see their growth rate slow, over this period. We do this to reflect that growth tends to slow more in the early years than it does in later years.
Generally we assume that a dollar today is more valuable than a dollar in the future, so we discount the value of these future cash flows to their estimated value in today's dollars:
10-year free cash flow (FCF) forecast
2024 | 2025 | 2026 | 2027 | 2028 | 2029 | 2030 | 2031 | 2032 | 2033 | |
Levered FCF ($, Millions) | US$18.6m | US$27.3m | US$25.7m | US$24.8m | US$24.4m | US$24.3m | US$24.3m | US$24.6m | US$24.9m | US$25.3m |
Growth Rate Estimate Source | Analyst x3 | Analyst x1 | Est @ -5.83% | Est @ -3.41% | Est @ -1.72% | Est @ -0.54% | Est @ 0.29% | Est @ 0.87% | Est @ 1.27% | Est @ 1.56% |
Present Value ($, Millions) Discounted @ 8.5% | US$17.1 | US$23.2 | US$20.1 | US$17.9 | US$16.2 | US$14.9 | US$13.8 | US$12.8 | US$11.9 | US$11.2 |
("Est" = FCF growth rate estimated by Simply Wall St)
Present Value of 10-year Cash Flow (PVCF) = US$159m
We now need to calculate the Terminal Value, which accounts for all the future cash flows after this ten year period. The Gordon Growth formula is used to calculate Terminal Value at a future annual growth rate equal to the 5-year average of the 10-year government bond yield of 2.2%. We discount the terminal cash flows to today's value at a cost of equity of 8.5%.
Terminal Value (TV)= FCF2033 × (1 + g) ÷ (r – g) = US$25m× (1 + 2.2%) ÷ (8.5%– 2.2%) = US$412m
Present Value of Terminal Value (PVTV)= TV / (1 + r)10= US$412m÷ ( 1 + 8.5%)10= US$182m
The total value is the sum of cash flows for the next ten years plus the discounted terminal value, which results in the Total Equity Value, which in this case is US$341m. To get the intrinsic value per share, we divide this by the total number of shares outstanding. Compared to the current share price of US$10.0, the company appears quite good value at a 49% discount to where the stock price trades currently. The assumptions in any calculation have a big impact on the valuation, so it is better to view this as a rough estimate, not precise down to the last cent.
The Assumptions
Now the most important inputs to a discounted cash flow are the discount rate, and of course, the actual cash flows. You don't have to agree with these inputs, I recommend redoing the calculations yourself and playing with them. The DCF also does not consider the possible cyclicality of an industry, or a company's future capital requirements, so it does not give a full picture of a company's potential performance. Given that we are looking at Turtle Beach as potential shareholders, the cost of equity is used as the discount rate, rather than the cost of capital (or weighted average cost of capital, WACC) which accounts for debt. In this calculation we've used 8.5%, which is based on a levered beta of 1.255. Beta is a measure of a stock's volatility, compared to the market as a whole. We get our beta from the industry average beta of globally comparable companies, with an imposed limit between 0.8 and 2.0, which is a reasonable range for a stable business.
SWOT Analysis for Turtle Beach
Strength
Debt is not viewed as a risk.
Weakness
Shareholders have been diluted in the past year.
Opportunity
Forecast to reduce losses next year.
Has sufficient cash runway for more than 3 years based on current free cash flows.
Trading below our estimate of fair value by more than 20%.
Threat
No apparent threats visible for HEAR.
Looking Ahead:
Valuation is only one side of the coin in terms of building your investment thesis, and it ideally won't be the sole piece of analysis you scrutinize for a company. DCF models are not the be-all and end-all of investment valuation. Rather it should be seen as a guide to "what assumptions need to be true for this stock to be under/overvalued?" For instance, if the terminal value growth rate is adjusted slightly, it can dramatically alter the overall result. What is the reason for the share price sitting below the intrinsic value? For Turtle Beach, there are three essential items you should further research:
Risks: Consider for instance, the ever-present spectre of investment risk. We've identified 1 warning sign with Turtle Beach , and understanding it should be part of your investment process.
Future Earnings: How does HEAR's growth rate compare to its peers and the wider market? Dig deeper into the analyst consensus number for the upcoming years by interacting with our free analyst growth expectation chart.
Other High Quality Alternatives: Do you like a good all-rounder? Explore our interactive list of high quality stocks to get an idea of what else is out there you may be missing!
PS. Simply Wall St updates its DCF calculation for every American stock every day, so if you want to find the intrinsic value of any other stock just search here.
Have feedback on this article? Concerned about the content? Get in touch with us directly. Alternatively, email editorial-team (at) simplywallst.com.
This article by Simply Wall St is general in nature. We provide commentary based on historical data and analyst forecasts only using an unbiased methodology and our articles are not intended to be financial advice. It does not constitute a recommendation to buy or sell any stock, and does not take account of your objectives, or your financial situation. We aim to bring you long-term focused analysis driven by fundamental data. Note that our analysis may not factor in the latest price-sensitive company announcements or qualitative material. Simply Wall St has no position in any stocks mentioned.
