
 Yahoo Finance
 Introducing AEM Holdings (SGX:AWX), The Stock That Rocketed 2254% In The Last Five Years

We think all investors should try to buy and hold high quality multi-year winners. And we've seen some truly amazing gains over the years. Don't believe it? Then look at the AEM Holdings Ltd (SGX:AWX) share price. It's 2254% higher than it was five years ago. If that doesn't get you thinking about long term investing, we don't know what will. On top of that, the share price is up 77% in about a quarter.
Anyone who held for that rewarding ride would probably be keen to talk about it.
See our latest analysis for AEM Holdings
To quote Buffett, 'Ships will sail around the world but the Flat Earth Society will flourish. There will continue to be wide discrepancies between price and value in the marketplace...' One flawed but reasonable way to assess how sentiment around a company has changed is to compare the earnings per share (EPS) with the share price.
During the five years of share price growth, AEM Holdings moved from a loss to profitability. Sometimes, the start of profitability is a major inflection point that can signal fast earnings growth to come, which in turn justifies very strong share price gains. Since the company was unprofitable five years ago, but not three years ago, it's worth taking a look at the returns in the last three years, too. We can see that the AEM Holdings share price is up 1188% in the last three years. Meanwhile, EPS is up 61% per year. Notably, the EPS growth has been slower than the annualised share price gain of 134% over three years. So it's fair to assume the market has a higher opinion of the business than it did three years ago.
The graphic below depicts how EPS has changed over time (unveil the exact values by clicking on the image).
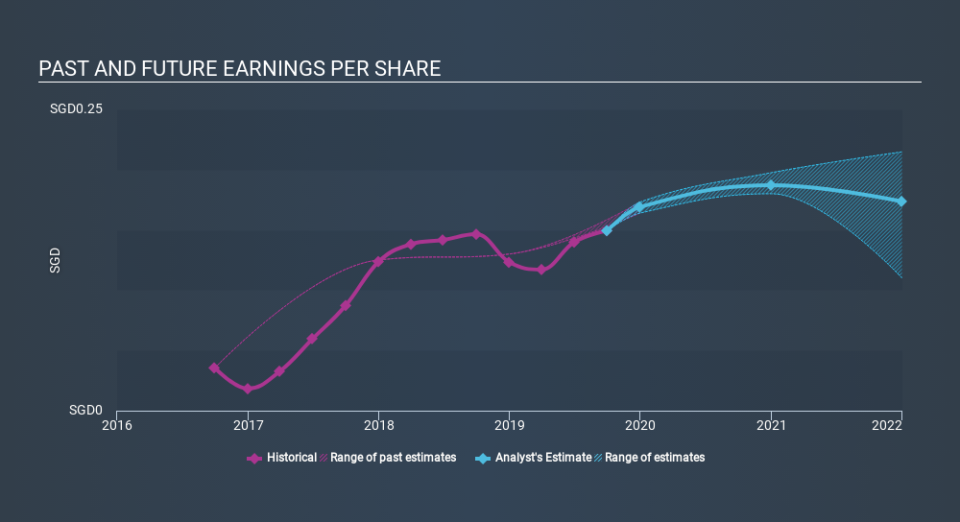
It is of course excellent to see how AEM Holdings has grown profits over the years, but the future is more important for shareholders. Take a more thorough look at AEM Holdings's financial health with this free report on its balance sheet.
What About Dividends?
When looking at investment returns, it is important to consider the difference between total shareholder return (TSR) and share price return. The TSR incorporates the value of any spin-offs or discounted capital raisings, along with any dividends, based on the assumption that the dividends are reinvested. It's fair to say that the TSR gives a more complete picture for stocks that pay a dividend. In the case of AEM Holdings, it has a TSR of 2541% for the last 5 years. That exceeds its share price return that we previously mentioned. And there's no prize for guessing that the dividend payments largely explain the divergence!
A Different Perspective
It's nice to see that AEM Holdings shareholders have received a total shareholder return of 144% over the last year. Of course, that includes the dividend. That gain is better than the annual TSR over five years, which is 92%. Therefore it seems like sentiment around the company has been positive lately. Someone with an optimistic perspective could view the recent improvement in TSR as indicating that the business itself is getting better with time. Is AEM Holdings cheap compared to other companies? These 3 valuation measures might help you decide.
If you are like me, then you will not want to miss this free list of growing companies that insiders are buying.
Please note, the market returns quoted in this article reflect the market weighted average returns of stocks that currently trade on SG exchanges.
If you spot an error that warrants correction, please contact the editor at editorial-team@simplywallst.com. This article by Simply Wall St is general in nature. It does not constitute a recommendation to buy or sell any stock, and does not take account of your objectives, or your financial situation. Simply Wall St has no position in the stocks mentioned.
We aim to bring you long-term focused research analysis driven by fundamental data. Note that our analysis may not factor in the latest price-sensitive company announcements or qualitative material. Thank you for reading.
