
 Yahoo Finance
 Introducing EYEMAXX Real Estate (ETR:BNT1), A Stock That Climbed 43% In The Last Five Years

While EYEMAXX Real Estate AG (ETR:BNT1) shareholders are probably generally happy, the stock hasn't had particularly good run recently, with the share price falling 25% in the last quarter. But that doesn't change the fact that the returns over the last five years have been pleasing. It has returned a market beating 43% in that time.
View our latest analysis for EYEMAXX Real Estate
To quote Buffett, 'Ships will sail around the world but the Flat Earth Society will flourish. There will continue to be wide discrepancies between price and value in the marketplace...' By comparing earnings per share (EPS) and share price changes over time, we can get a feel for how investor attitudes to a company have morphed over time.
During five years of share price growth, EYEMAXX Real Estate achieved compound earnings per share (EPS) growth of 9.0% per year. This EPS growth is higher than the 7.4% average annual increase in the share price. So it seems the market isn't so enthusiastic about the stock these days. The reasonably low P/E ratio of 7.34 also suggests market apprehension.
You can see below how EPS has changed over time (discover the exact values by clicking on the image).
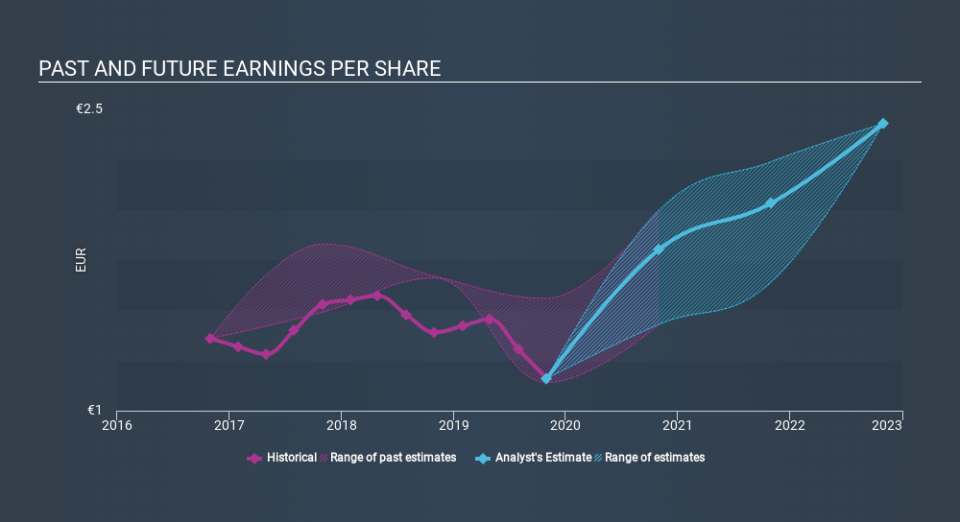
Before buying or selling a stock, we always recommend a close examination of historic growth trends, available here.
What About Dividends?
As well as measuring the share price return, investors should also consider the total shareholder return (TSR). Whereas the share price return only reflects the change in the share price, the TSR includes the value of dividends (assuming they were reinvested) and the benefit of any discounted capital raising or spin-off. It's fair to say that the TSR gives a more complete picture for stocks that pay a dividend. As it happens, EYEMAXX Real Estate's TSR for the last 5 years was 70%, which exceeds the share price return mentioned earlier. This is largely a result of its dividend payments!
A Different Perspective
While the broader market gained around 1.5% in the last year, EYEMAXX Real Estate shareholders lost 14% (even including dividends) . Even the share prices of good stocks drop sometimes, but we want to see improvements in the fundamental metrics of a business, before getting too interested. Longer term investors wouldn't be so upset, since they would have made 11%, each year, over five years. It could be that the recent sell-off is an opportunity, so it may be worth checking the fundamental data for signs of a long term growth trend. It's always interesting to track share price performance over the longer term. But to understand EYEMAXX Real Estate better, we need to consider many other factors. For example, we've discovered 7 warning signs for EYEMAXX Real Estate (1 is potentially serious!) that you should be aware of before investing here.
For those who like to find winning investments this free list of growing companies with recent insider purchasing, could be just the ticket.
Please note, the market returns quoted in this article reflect the market weighted average returns of stocks that currently trade on DE exchanges.
If you spot an error that warrants correction, please contact the editor at editorial-team@simplywallst.com. This article by Simply Wall St is general in nature. It does not constitute a recommendation to buy or sell any stock, and does not take account of your objectives, or your financial situation. Simply Wall St has no position in the stocks mentioned.
We aim to bring you long-term focused research analysis driven by fundamental data. Note that our analysis may not factor in the latest price-sensitive company announcements or qualitative material. Thank you for reading.
