
 Yahoo Finance
 Introducing Renishaw (LON:RSW), The Stock That Zoomed 148% In The Last Five Years

When you buy a stock there is always a possibility that it could drop 100%. But when you pick a company that is really flourishing, you can make more than 100%. One great example is Renishaw plc (LON:RSW) which saw its share price drive 148% higher over five years. In more good news, the share price has risen 0.04% in thirty days.
Check out our latest analysis for Renishaw
There is no denying that markets are sometimes efficient, but prices do not always reflect underlying business performance. One imperfect but simple way to consider how the market perception of a company has shifted is to compare the change in the earnings per share (EPS) with the share price movement.
During five years of share price growth, Renishaw achieved compound earnings per share (EPS) growth of 20% per year. That makes the EPS growth particularly close to the yearly share price growth of 20%. That suggests that the market sentiment around the company hasn't changed much over that time. In fact, the share price seems to largely reflect the EPS growth.
The company's earnings per share (over time) is depicted in the image below (click to see the exact numbers).
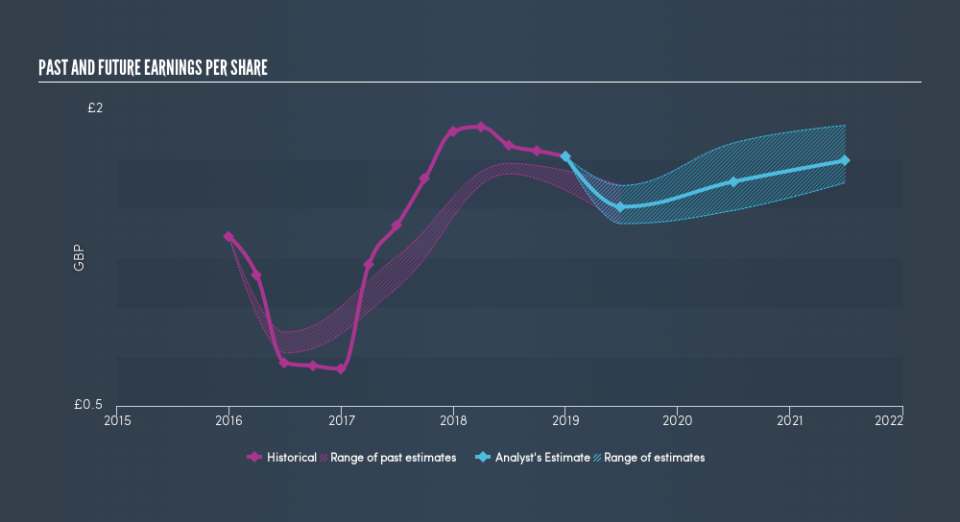
This free interactive report on Renishaw's earnings, revenue and cash flow is a great place to start, if you want to investigate the stock further.
What About Dividends?
As well as measuring the share price return, investors should also consider the total shareholder return (TSR). The TSR incorporates the value of any spin-offs or discounted capital raisings, along with any dividends, based on the assumption that the dividends are reinvested. It's fair to say that the TSR gives a more complete picture for stocks that pay a dividend. In the case of Renishaw, it has a TSR of 171% for the last 5 years. That exceeds its share price return that we previously mentioned. This is largely a result of its dividend payments!
A Different Perspective
While the broader market gained around 6.6% in the last year, Renishaw shareholders lost 4.5% (even including dividends). Even the share prices of good stocks drop sometimes, but we want to see improvements in the fundamental metrics of a business, before getting too interested. On the bright side, long term shareholders have made money, with a gain of 22% per year over half a decade. If the fundamental data continues to indicate long term sustainable growth, the current sell-off could be an opportunity worth considering. Most investors take the time to check the data on insider transactions. You can click here to see if insiders have been buying or selling.
If you like to buy stocks alongside management, then you might just love this free list of companies. (Hint: insiders have been buying them).
Please note, the market returns quoted in this article reflect the market weighted average returns of stocks that currently trade on GB exchanges.
We aim to bring you long-term focused research analysis driven by fundamental data. Note that our analysis may not factor in the latest price-sensitive company announcements or qualitative material.
If you spot an error that warrants correction, please contact the editor at editorial-team@simplywallst.com. This article by Simply Wall St is general in nature. It does not constitute a recommendation to buy or sell any stock, and does not take account of your objectives, or your financial situation. Simply Wall St has no position in the stocks mentioned. Thank you for reading.
