
 Yahoo Finance
 Introducing Royal Boskalis Westminster (AMS:BOKA), The Stock That Dropped 49% In The Last Five Years

While it may not be enough for some shareholders, we think it is good to see the Royal Boskalis Westminster N.V. (AMS:BOKA) share price up 19% in a single quarter. But if you look at the last five years the returns have not been good. After all, the share price is down 49% in that time, significantly under-performing the market.
View our latest analysis for Royal Boskalis Westminster
Royal Boskalis Westminster isn't currently profitable, so most analysts would look to revenue growth to get an idea of how fast the underlying business is growing. Generally speaking, companies without profits are expected to grow revenue every year, and at a good clip. As you can imagine, fast revenue growth, when maintained, often leads to fast profit growth.
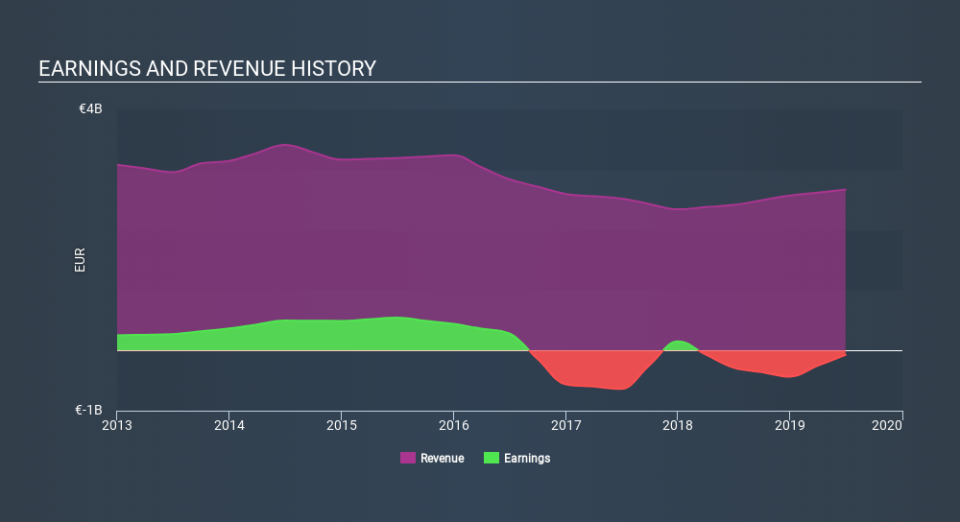
In the last five years Royal Boskalis Westminster saw its revenue shrink by 7.1% per year. That's not what investors generally want to see. The stock hasn't done well for shareholders in the last five years, falling 13%, annualized. Unfortunately, though, it makes sense given the lack of either profits or revenue growth. Without profits, its hard to see how shareholders win if the revenue keeps falling.
The graphic below depicts how earnings and revenue have changed over time (unveil the exact values by clicking on the image).
This free interactive report on Royal Boskalis Westminster's balance sheet strength is a great place to start, if you want to investigate the stock further.
What About Dividends?
As well as measuring the share price return, investors should also consider the total shareholder return (TSR). Whereas the share price return only reflects the change in the share price, the TSR includes the value of dividends (assuming they were reinvested) and the benefit of any discounted capital raising or spin-off. Arguably, the TSR gives a more comprehensive picture of the return generated by a stock. In the case of Royal Boskalis Westminster, it has a TSR of -39% for the last 5 years. That exceeds its share price return that we previously mentioned. And there's no prize for guessing that the dividend payments largely explain the divergence!
A Different Perspective
Royal Boskalis Westminster provided a TSR of 6.9% over the last twelve months. But that return falls short of the market. But at least that's still a gain! Over five years the TSR has been a reduction of 9.3% per year, over five years. It could well be that the business is stabilizing. You could get a better understanding of Royal Boskalis Westminster's growth by checking out this more detailed historical graph of earnings, revenue and cash flow.
Of course Royal Boskalis Westminster may not be the best stock to buy. So you may wish to see this free collection of growth stocks.
Please note, the market returns quoted in this article reflect the market weighted average returns of stocks that currently trade on NL exchanges.
If you spot an error that warrants correction, please contact the editor at editorial-team@simplywallst.com. This article by Simply Wall St is general in nature. It does not constitute a recommendation to buy or sell any stock, and does not take account of your objectives, or your financial situation. Simply Wall St has no position in the stocks mentioned.
We aim to bring you long-term focused research analysis driven by fundamental data. Note that our analysis may not factor in the latest price-sensitive company announcements or qualitative material. Thank you for reading.
