
 Yahoo Finance
 Is Intuit Inc. (NASDAQ:INTU) As Strong As Its Balance Sheet Indicates?

With a market capitalization of US$73b, Intuit Inc. (NASDAQ:INTU) is a large-cap stock, which is considered by most investors as a safe bet. Common characteristics for these big stocks are their strong balance sheet and high liquidity, which means there's plenty of stocks available to the public for trading. These firms won’t be left high and dry if liquidity dries up, and they will be relatively unaffected by rises in interest rates. Using the most recent data for INTU, I will determine its financial status based on its solvency and liquidity, and assess whether the stock is a safe investment.
View our latest analysis for Intuit
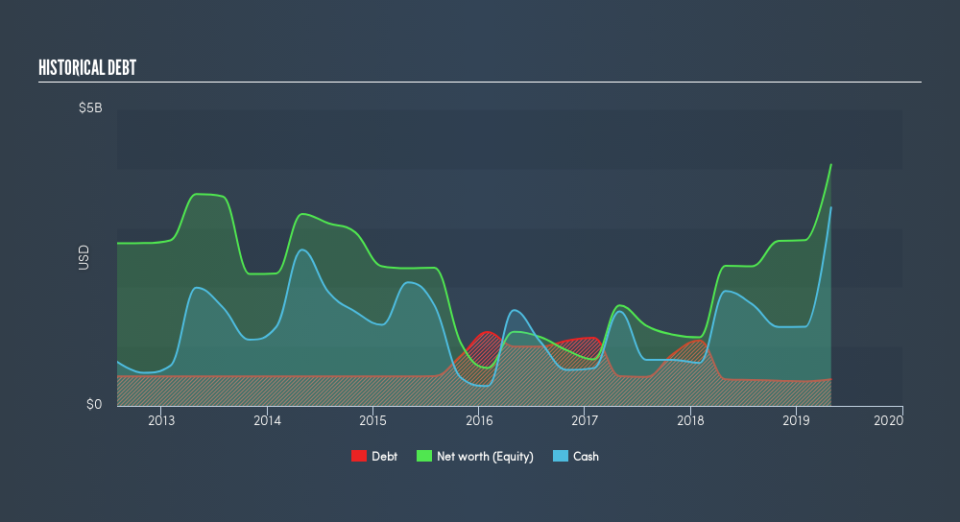
INTU’s Debt (And Cash Flows)
Over the past year, INTU has maintained its debt levels at around US$448m which accounts for long term debt. At this current level of debt, the current cash and short-term investment levels stands at US$3.3b to keep the business going. Moreover, INTU has generated US$2.4b in operating cash flow in the last twelve months, resulting in an operating cash to total debt ratio of 538%, indicating that INTU’s current level of operating cash is high enough to cover debt.
Can INTU pay its short-term liabilities?
With current liabilities at US$2.3b, it appears that the company has maintained a safe level of current assets to meet its obligations, with the current ratio last standing at 1.85x. The current ratio is the number you get when you divide current assets by current liabilities. Generally, for Software companies, this is a reasonable ratio as there's enough of a cash buffer without holding too much capital in low return investments.
Can INTU service its debt comfortably?
INTU’s level of debt is appropriate relative to its total equity, at 11%. INTU is not taking on too much debt commitment, which may be constraining for future growth.
Next Steps:
INTU’s high cash coverage and low debt levels indicate its ability to utilise its borrowings efficiently in order to generate ample cash flow. Furthermore, the company exhibits an ability to meet its near-term obligations, which isn't a big surprise for a large-cap. I admit this is a fairly basic analysis for INTU's financial health. Other important fundamentals need to be considered alongside. I suggest you continue to research Intuit to get a better picture of the stock by looking at:
Future Outlook: What are well-informed industry analysts predicting for INTU’s future growth? Take a look at our free research report of analyst consensus for INTU’s outlook.
Valuation: What is INTU worth today? Is the stock undervalued, even when its growth outlook is factored into its intrinsic value? The intrinsic value infographic in our free research report helps visualize whether INTU is currently mispriced by the market.
Other High-Performing Stocks: Are there other stocks that provide better prospects with proven track records? Explore our free list of these great stocks here.
We aim to bring you long-term focused research analysis driven by fundamental data. Note that our analysis may not factor in the latest price-sensitive company announcements or qualitative material.
If you spot an error that warrants correction, please contact the editor at editorial-team@simplywallst.com. This article by Simply Wall St is general in nature. It does not constitute a recommendation to buy or sell any stock, and does not take account of your objectives, or your financial situation. Simply Wall St has no position in the stocks mentioned. Thank you for reading.
