
 Yahoo Finance
 Should You Invest In Spire Healthcare Group (LON:SPI)?

What are the early trends we should look for to identify a stock that could multiply in value over the long term? Typically, we'll want to notice a trend of growing return on capital employed (ROCE) and alongside that, an expanding base of capital employed. If you see this, it typically means it's a company with a great business model and plenty of profitable reinvestment opportunities. Speaking of which, we noticed some great changes in Spire Healthcare Group's (LON:SPI) returns on capital, so let's have a look.
What is Return On Capital Employed (ROCE)?
For those who don't know, ROCE is a measure of a company's yearly pre-tax profit (its return), relative to the capital employed in the business. The formula for this calculation on Spire Healthcare Group is:
Return on Capital Employed = Earnings Before Interest and Tax (EBIT) ÷ (Total Assets - Current Liabilities)
0.25 = UK£112m ÷ (UK£591m - UK£139m) (Based on the trailing twelve months to June 2020).
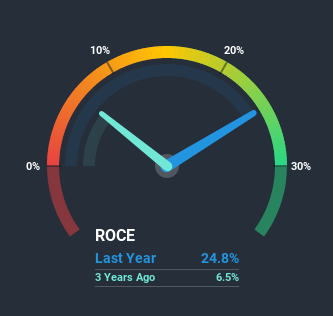
So, Spire Healthcare Group has an ROCE of 25%. That's a fantastic return and not only that, it outpaces the average of 13% earned by companies in a similar industry.
View our latest analysis for Spire Healthcare Group
Above you can see how the current ROCE for Spire Healthcare Group compares to its prior returns on capital, but there's only so much you can tell from the past. If you'd like to see what analysts are forecasting going forward, you should check out our free report for Spire Healthcare Group.
What Does the ROCE Trend For Spire Healthcare Group Tell Us?
We're pretty happy with how the ROCE has been trending at Spire Healthcare Group. The figures show that over the last five years, returns on capital have grown by 225%. The company is now earning UK£0.2 per dollar of capital employed. Interestingly, the business may be becoming more efficient because it's applying 70% less capital than it was five years ago. A business that's shrinking its asset base like this isn't usually typical of a soon to be multi-bagger company.
On a side note, we noticed that the improvement in ROCE appears to be partly fueled by an increase in current liabilities. Essentially the business now has suppliers or short-term creditors funding about 24% of its operations, which isn't ideal. It's worth keeping an eye on this because as the percentage of current liabilities to total assets increases, some aspects of risk also increase.
Our Take On Spire Healthcare Group's ROCE
In a nutshell, we're pleased to see that Spire Healthcare Group has been able to generate higher returns from less capital. Although the company may be facing some issues elsewhere since the stock has plunged 76% in the last five years. Regardless, we think the underlying fundamentals warrant this stock for further investigation.
While Spire Healthcare Group looks impressive, no company is worth an infinite price. The intrinsic value infographic in our free research report helps visualize whether SPI is currently trading for a fair price.
If you'd like to see other companies earning high returns, check out our free list of companies earning high returns with solid balance sheets here.
This article by Simply Wall St is general in nature. It does not constitute a recommendation to buy or sell any stock, and does not take account of your objectives, or your financial situation. We aim to bring you long-term focused analysis driven by fundamental data. Note that our analysis may not factor in the latest price-sensitive company announcements or qualitative material. Simply Wall St has no position in any stocks mentioned.
Have feedback on this article? Concerned about the content? Get in touch with us directly. Alternatively, email editorial-team@simplywallst.com.