
 Yahoo Finance
 Investing in Aegon (AMS:AGN) three years ago would have delivered you a 65% gain
By buying an index fund, investors can approximate the average market return. But if you pick the right individual stocks, you could make more than that. Just take a look at Aegon Ltd. (AMS:AGN), which is up 44%, over three years, soundly beating the market return of 12% (not including dividends).
So let's investigate and see if the longer term performance of the company has been in line with the underlying business' progress.
See our latest analysis for Aegon
Because Aegon made a loss in the last twelve months, we think the market is probably more focussed on revenue and revenue growth, at least for now. Shareholders of unprofitable companies usually desire strong revenue growth. Some companies are willing to postpone profitability to grow revenue faster, but in that case one would hope for good top-line growth to make up for the lack of earnings.
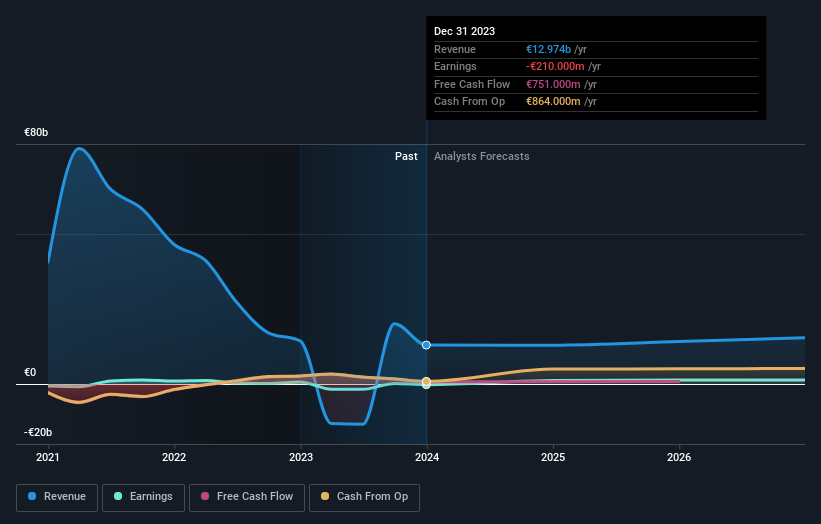
In the last 3 years Aegon saw its revenue shrink by 68% per year. Despite the lack of revenue growth, the stock has returned 13%, compound, over three years. If the company is cutting costs profitability could be on the horizon, but the revenue decline is a prima facie concern.
You can see below how earnings and revenue have changed over time (discover the exact values by clicking on the image).
Take a more thorough look at Aegon's financial health with this free report on its balance sheet.
What About Dividends?
As well as measuring the share price return, investors should also consider the total shareholder return (TSR). The TSR incorporates the value of any spin-offs or discounted capital raisings, along with any dividends, based on the assumption that the dividends are reinvested. So for companies that pay a generous dividend, the TSR is often a lot higher than the share price return. In the case of Aegon, it has a TSR of 65% for the last 3 years. That exceeds its share price return that we previously mentioned. The dividends paid by the company have thusly boosted the total shareholder return.
A Different Perspective
We're pleased to report that Aegon shareholders have received a total shareholder return of 49% over one year. That's including the dividend. Since the one-year TSR is better than the five-year TSR (the latter coming in at 10% per year), it would seem that the stock's performance has improved in recent times. Given the share price momentum remains strong, it might be worth taking a closer look at the stock, lest you miss an opportunity. It's always interesting to track share price performance over the longer term. But to understand Aegon better, we need to consider many other factors. For instance, we've identified 1 warning sign for Aegon that you should be aware of.
But note: Aegon may not be the best stock to buy. So take a peek at this free list of interesting companies with past earnings growth (and further growth forecast).
Please note, the market returns quoted in this article reflect the market weighted average returns of stocks that currently trade on Dutch exchanges.
Have feedback on this article? Concerned about the content? Get in touch with us directly. Alternatively, email editorial-team (at) simplywallst.com.
This article by Simply Wall St is general in nature. We provide commentary based on historical data and analyst forecasts only using an unbiased methodology and our articles are not intended to be financial advice. It does not constitute a recommendation to buy or sell any stock, and does not take account of your objectives, or your financial situation. We aim to bring you long-term focused analysis driven by fundamental data. Note that our analysis may not factor in the latest price-sensitive company announcements or qualitative material. Simply Wall St has no position in any stocks mentioned.
