
 Yahoo Finance
 Investing in Blancco Technology Group (LON:BLTG) five years ago would have delivered you a 71% gain
While Blancco Technology Group plc (LON:BLTG) shareholders are probably generally happy, the stock hasn't had particularly good run recently, with the share price falling 13% in the last quarter. Looking further back, the stock has generated good profits over five years. It has returned a market beating 71% in that time. Unfortunately not all shareholders will have held it for the long term, so spare a thought for those caught in the 26% decline over the last twelve months.
Let's take a look at the underlying fundamentals over the longer term, and see if they've been consistent with shareholders returns.
See our latest analysis for Blancco Technology Group
To quote Buffett, 'Ships will sail around the world but the Flat Earth Society will flourish. There will continue to be wide discrepancies between price and value in the marketplace...' One flawed but reasonable way to assess how sentiment around a company has changed is to compare the earnings per share (EPS) with the share price.
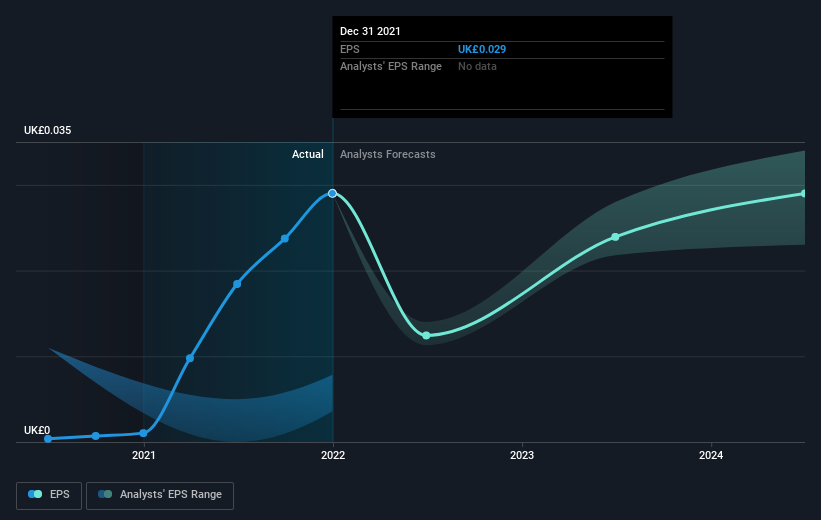
During the five years of share price growth, Blancco Technology Group moved from a loss to profitability. That would generally be considered a positive, so we'd expect the share price to be up. Since the company was unprofitable five years ago, but not three years ago, it's worth taking a look at the returns in the last three years, too. Indeed, the Blancco Technology Group share price has gained 55% in three years. During the same period, EPS grew by 36% each year. This EPS growth is higher than the 16% average annual increase in the share price over the same three years. Therefore, it seems the market has moderated its expectations for growth, somewhat. Having said that, the market is still optimistic, given the P/E ratio of 68.25.
You can see how EPS has changed over time in the image below (click on the chart to see the exact values).
We know that Blancco Technology Group has improved its bottom line over the last three years, but what does the future have in store? This free interactive report on Blancco Technology Group's balance sheet strength is a great place to start, if you want to investigate the stock further.
A Different Perspective
We regret to report that Blancco Technology Group shareholders are down 26% for the year. Unfortunately, that's worse than the broader market decline of 7.5%. However, it could simply be that the share price has been impacted by broader market jitters. It might be worth keeping an eye on the fundamentals, in case there's a good opportunity. Longer term investors wouldn't be so upset, since they would have made 11%, each year, over five years. It could be that the recent sell-off is an opportunity, so it may be worth checking the fundamental data for signs of a long term growth trend. While it is well worth considering the different impacts that market conditions can have on the share price, there are other factors that are even more important. Case in point: We've spotted 1 warning sign for Blancco Technology Group you should be aware of.
But note: Blancco Technology Group may not be the best stock to buy. So take a peek at this free list of interesting companies with past earnings growth (and further growth forecast).
Please note, the market returns quoted in this article reflect the market weighted average returns of stocks that currently trade on GB exchanges.
Have feedback on this article? Concerned about the content? Get in touch with us directly. Alternatively, email editorial-team (at) simplywallst.com.
This article by Simply Wall St is general in nature. We provide commentary based on historical data and analyst forecasts only using an unbiased methodology and our articles are not intended to be financial advice. It does not constitute a recommendation to buy or sell any stock, and does not take account of your objectives, or your financial situation. We aim to bring you long-term focused analysis driven by fundamental data. Note that our analysis may not factor in the latest price-sensitive company announcements or qualitative material. Simply Wall St has no position in any stocks mentioned.
