
 Yahoo Finance
 Investing in CDL Investments New Zealand (NZSE:CDI) five years ago would have delivered you a 4.3% gain
The main aim of stock picking is to find the market-beating stocks. But even the best stock picker will only win with some selections. At this point some shareholders may be questioning their investment in CDL Investments New Zealand Limited (NZSE:CDI), since the last five years saw the share price fall 17%.
With that in mind, it's worth seeing if the company's underlying fundamentals have been the driver of long term performance, or if there are some discrepancies.
View our latest analysis for CDL Investments New Zealand
There is no denying that markets are sometimes efficient, but prices do not always reflect underlying business performance. By comparing earnings per share (EPS) and share price changes over time, we can get a feel for how investor attitudes to a company have morphed over time.
During the five years over which the share price declined, CDL Investments New Zealand's earnings per share (EPS) dropped by 1.5% each year. This reduction in EPS is less than the 4% annual reduction in the share price. This implies that the market was previously too optimistic about the stock. The less favorable sentiment is reflected in its current P/E ratio of 7.09.
The company's earnings per share (over time) is depicted in the image below (click to see the exact numbers).
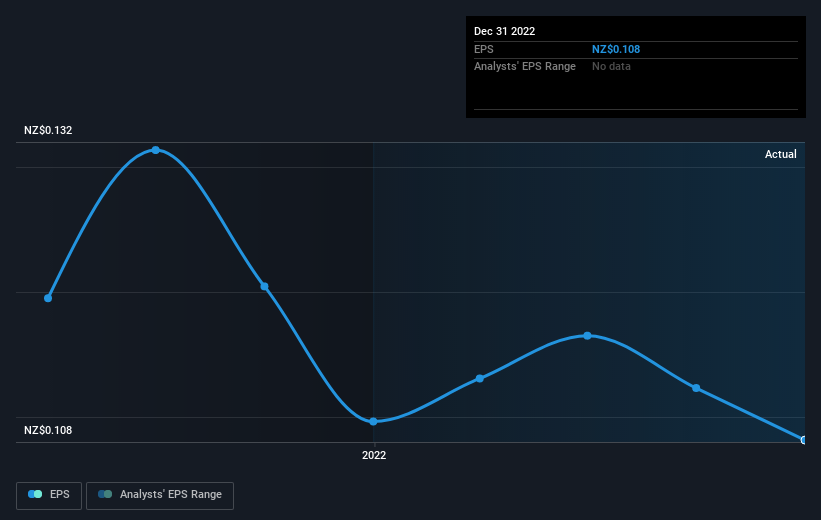
It might be well worthwhile taking a look at our free report on CDL Investments New Zealand's earnings, revenue and cash flow.
What About Dividends?
It is important to consider the total shareholder return, as well as the share price return, for any given stock. The TSR is a return calculation that accounts for the value of cash dividends (assuming that any dividend received was reinvested) and the calculated value of any discounted capital raisings and spin-offs. So for companies that pay a generous dividend, the TSR is often a lot higher than the share price return. As it happens, CDL Investments New Zealand's TSR for the last 5 years was 4.3%, which exceeds the share price return mentioned earlier. This is largely a result of its dividend payments!
A Different Perspective
CDL Investments New Zealand shareholders are down 13% for the year (even including dividends), but the market itself is up 3.6%. Even the share prices of good stocks drop sometimes, but we want to see improvements in the fundamental metrics of a business, before getting too interested. On the bright side, long term shareholders have made money, with a gain of 0.8% per year over half a decade. It could be that the recent sell-off is an opportunity, so it may be worth checking the fundamental data for signs of a long term growth trend. I find it very interesting to look at share price over the long term as a proxy for business performance. But to truly gain insight, we need to consider other information, too. Case in point: We've spotted 2 warning signs for CDL Investments New Zealand you should be aware of, and 1 of them can't be ignored.
But note: CDL Investments New Zealand may not be the best stock to buy. So take a peek at this free list of interesting companies with past earnings growth (and further growth forecast).
Please note, the market returns quoted in this article reflect the market weighted average returns of stocks that currently trade on New Zealander exchanges.
Have feedback on this article? Concerned about the content? Get in touch with us directly. Alternatively, email editorial-team (at) simplywallst.com.
This article by Simply Wall St is general in nature. We provide commentary based on historical data and analyst forecasts only using an unbiased methodology and our articles are not intended to be financial advice. It does not constitute a recommendation to buy or sell any stock, and does not take account of your objectives, or your financial situation. We aim to bring you long-term focused analysis driven by fundamental data. Note that our analysis may not factor in the latest price-sensitive company announcements or qualitative material. Simply Wall St has no position in any stocks mentioned.
Join A Paid User Research Session
You’ll receive a US$30 Amazon Gift card for 1 hour of your time while helping us build better investing tools for the individual investors like yourself. Sign up here
