
 Yahoo Finance
 Investing in Charles Schwab (NYSE:SCHW) three years ago would have delivered you a 98% gain
By buying an index fund, you can roughly match the market return with ease. But if you choose individual stocks with prowess, you can make superior returns. For example, the The Charles Schwab Corporation (NYSE:SCHW) share price is up 90% in the last three years, clearly besting the market return of around 22% (not including dividends).
So let's assess the underlying fundamentals over the last 3 years and see if they've moved in lock-step with shareholder returns.
See our latest analysis for Charles Schwab
While the efficient markets hypothesis continues to be taught by some, it has been proven that markets are over-reactive dynamic systems, and investors are not always rational. One imperfect but simple way to consider how the market perception of a company has shifted is to compare the change in the earnings per share (EPS) with the share price movement.
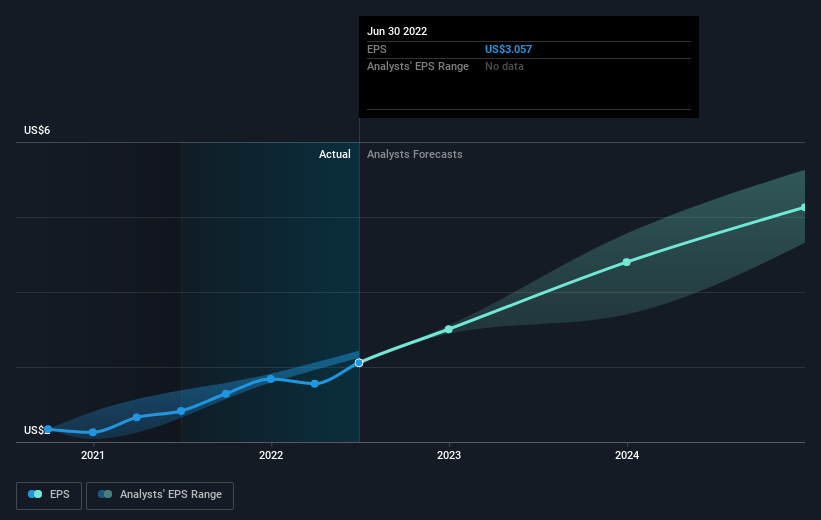
During three years of share price growth, Charles Schwab achieved compound earnings per share growth of 4.7% per year. In comparison, the 24% per year gain in the share price outpaces the EPS growth. This suggests that, as the business progressed over the last few years, it gained the confidence of market participants. That's not necessarily surprising considering the three-year track record of earnings growth.
You can see how EPS has changed over time in the image below (click on the chart to see the exact values).
We like that insiders have been buying shares in the last twelve months. Having said that, most people consider earnings and revenue growth trends to be a more meaningful guide to the business. This free interactive report on Charles Schwab's earnings, revenue and cash flow is a great place to start, if you want to investigate the stock further.
What About Dividends?
It is important to consider the total shareholder return, as well as the share price return, for any given stock. The TSR incorporates the value of any spin-offs or discounted capital raisings, along with any dividends, based on the assumption that the dividends are reinvested. Arguably, the TSR gives a more comprehensive picture of the return generated by a stock. As it happens, Charles Schwab's TSR for the last 3 years was 98%, which exceeds the share price return mentioned earlier. And there's no prize for guessing that the dividend payments largely explain the divergence!
A Different Perspective
Although it hurts that Charles Schwab returned a loss of 5.0% in the last twelve months, the broader market was actually worse, returning a loss of 21%. Longer term investors wouldn't be so upset, since they would have made 11%, each year, over five years. It could be that the business is just facing some short term problems, but shareholders should keep a close eye on the fundamentals. It's always interesting to track share price performance over the longer term. But to understand Charles Schwab better, we need to consider many other factors. Even so, be aware that Charles Schwab is showing 1 warning sign in our investment analysis , you should know about...
If you like to buy stocks alongside management, then you might just love this free list of companies. (Hint: insiders have been buying them).
Please note, the market returns quoted in this article reflect the market weighted average returns of stocks that currently trade on US exchanges.
Have feedback on this article? Concerned about the content? Get in touch with us directly. Alternatively, email editorial-team (at) simplywallst.com.
This article by Simply Wall St is general in nature. We provide commentary based on historical data and analyst forecasts only using an unbiased methodology and our articles are not intended to be financial advice. It does not constitute a recommendation to buy or sell any stock, and does not take account of your objectives, or your financial situation. We aim to bring you long-term focused analysis driven by fundamental data. Note that our analysis may not factor in the latest price-sensitive company announcements or qualitative material. Simply Wall St has no position in any stocks mentioned.
Join A Paid User Research Session
You’ll receive a US$30 Amazon Gift card for 1 hour of your time while helping us build better investing tools for the individual investors like yourself. Sign up here
