
 Yahoo Finance
 Investing in Clearwater Paper (NYSE:CLW) five years ago would have delivered you a 95% gain
Generally speaking the aim of active stock picking is to find companies that provide returns that are superior to the market average. And in our experience, buying the right stocks can give your wealth a significant boost. For example, the Clearwater Paper Corporation (NYSE:CLW) share price is up 95% in the last 5 years, clearly besting the market return of around 65% (ignoring dividends). On the other hand, the more recent gains haven't been so impressive, with shareholders gaining just 19%.
So let's investigate and see if the longer term performance of the company has been in line with the underlying business' progress.
See our latest analysis for Clearwater Paper
To quote Buffett, 'Ships will sail around the world but the Flat Earth Society will flourish. There will continue to be wide discrepancies between price and value in the marketplace...' By comparing earnings per share (EPS) and share price changes over time, we can get a feel for how investor attitudes to a company have morphed over time.
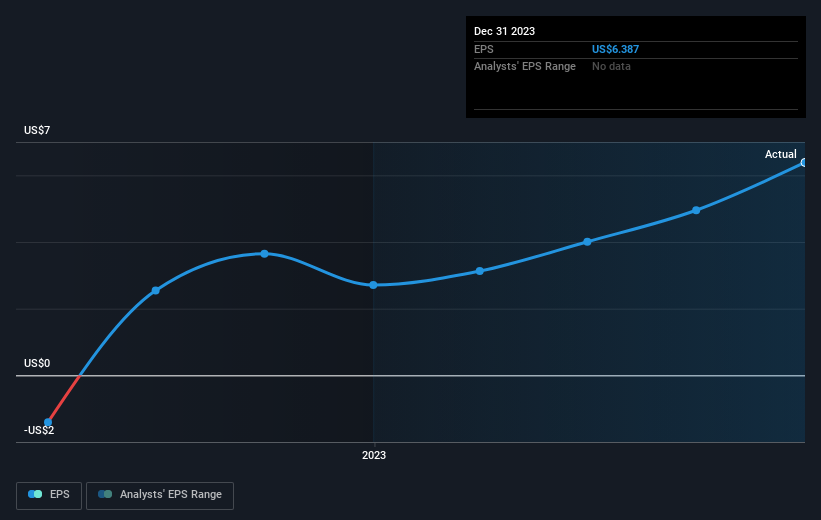
During the five years of share price growth, Clearwater Paper moved from a loss to profitability. That would generally be considered a positive, so we'd hope to see the share price to rise. Given that the company made a profit three years ago, but not five years ago, it is worth looking at the share price returns over the last three years, too. We can see that the Clearwater Paper share price is up 12% in the last three years. In the same period, EPS is up 12% per year. This EPS growth is higher than the 4% average annual increase in the share price over the same three years. So you might conclude the market is a little more cautious about the stock, these days. This unenthusiastic sentiment is reflected in the stock's reasonably modest P/E ratio of 6.03.
You can see below how EPS has changed over time (discover the exact values by clicking on the image).
We know that Clearwater Paper has improved its bottom line lately, but is it going to grow revenue? Check if analysts think Clearwater Paper will grow revenue in the future.
A Different Perspective
Clearwater Paper provided a TSR of 19% over the last twelve months. Unfortunately this falls short of the market return. On the bright side, that's still a gain, and it's actually better than the average return of 14% over half a decade It is possible that returns will improve along with the business fundamentals. It's always interesting to track share price performance over the longer term. But to understand Clearwater Paper better, we need to consider many other factors. Consider for instance, the ever-present spectre of investment risk. We've identified 1 warning sign with Clearwater Paper , and understanding them should be part of your investment process.
For those who like to find winning investments this free list of growing companies with recent insider purchasing, could be just the ticket.
Please note, the market returns quoted in this article reflect the market weighted average returns of stocks that currently trade on American exchanges.
Have feedback on this article? Concerned about the content? Get in touch with us directly. Alternatively, email editorial-team (at) simplywallst.com.
This article by Simply Wall St is general in nature. We provide commentary based on historical data and analyst forecasts only using an unbiased methodology and our articles are not intended to be financial advice. It does not constitute a recommendation to buy or sell any stock, and does not take account of your objectives, or your financial situation. We aim to bring you long-term focused analysis driven by fundamental data. Note that our analysis may not factor in the latest price-sensitive company announcements or qualitative material. Simply Wall St has no position in any stocks mentioned.
