
 Yahoo Finance
 Investing in Intuitive Surgical (NASDAQ:ISRG) five years ago would have delivered you a 338% gain
For many, the main point of investing in the stock market is to achieve spectacular returns. While not every stock performs well, when investors win, they can win big. For example, the Intuitive Surgical, Inc. (NASDAQ:ISRG) share price is up a whopping 338% in the last half decade, a handsome return for long term holders. If that doesn't get you thinking about long term investing, we don't know what will. On top of that, the share price is up 18% in about a quarter.
So let's investigate and see if the longer term performance of the company has been in line with the underlying business' progress.
See our latest analysis for Intuitive Surgical
While the efficient markets hypothesis continues to be taught by some, it has been proven that markets are over-reactive dynamic systems, and investors are not always rational. One way to examine how market sentiment has changed over time is to look at the interaction between a company's share price and its earnings per share (EPS).
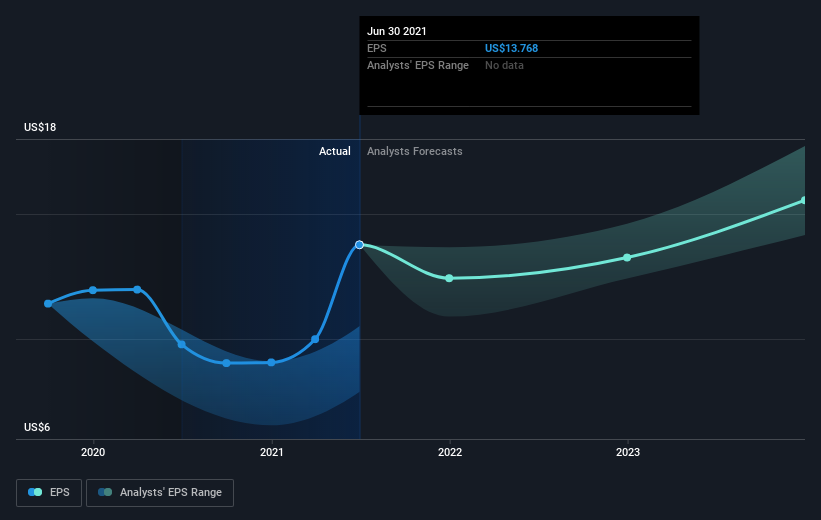
During five years of share price growth, Intuitive Surgical achieved compound earnings per share (EPS) growth of 18% per year. This EPS growth is slower than the share price growth of 34% per year, over the same period. So it's fair to assume the market has a higher opinion of the business than it did five years ago. And that's hardly shocking given the track record of growth. This optimism is visible in its fairly high P/E ratio of 76.07.
The company's earnings per share (over time) is depicted in the image below (click to see the exact numbers).
It's probably worth noting that the CEO is paid less than the median at similar sized companies. It's always worth keeping an eye on CEO pay, but a more important question is whether the company will grow earnings throughout the years. It might be well worthwhile taking a look at our free report on Intuitive Surgical's earnings, revenue and cash flow.
A Different Perspective
It's good to see that Intuitive Surgical has rewarded shareholders with a total shareholder return of 58% in the last twelve months. Since the one-year TSR is better than the five-year TSR (the latter coming in at 34% per year), it would seem that the stock's performance has improved in recent times. In the best case scenario, this may hint at some real business momentum, implying that now could be a great time to delve deeper. Before forming an opinion on Intuitive Surgical you might want to consider these 3 valuation metrics.
If you like to buy stocks alongside management, then you might just love this free list of companies. (Hint: insiders have been buying them).
Please note, the market returns quoted in this article reflect the market weighted average returns of stocks that currently trade on US exchanges.
This article by Simply Wall St is general in nature. We provide commentary based on historical data and analyst forecasts only using an unbiased methodology and our articles are not intended to be financial advice. It does not constitute a recommendation to buy or sell any stock, and does not take account of your objectives, or your financial situation. We aim to bring you long-term focused analysis driven by fundamental data. Note that our analysis may not factor in the latest price-sensitive company announcements or qualitative material. Simply Wall St has no position in any stocks mentioned.
Have feedback on this article? Concerned about the content? Get in touch with us directly. Alternatively, email editorial-team (at) simplywallst.com.
