
 Yahoo Finance
 Investing in Masco (NYSE:MAS) three years ago would have delivered you a 128% gain
The worst result, after buying shares in a company (assuming no leverage), would be if you lose all the money you put in. But in contrast you can make much more than 100% if the company does well. For example, the Masco Corporation (NYSE:MAS) share price has soared 120% in the last three years. How nice for those who held the stock! In more good news, the share price has risen 12% in thirty days.
With that in mind, it's worth seeing if the company's underlying fundamentals have been the driver of long term performance, or if there are some discrepancies.
See our latest analysis for Masco
There is no denying that markets are sometimes efficient, but prices do not always reflect underlying business performance. One flawed but reasonable way to assess how sentiment around a company has changed is to compare the earnings per share (EPS) with the share price.
During the three years of share price growth, Masco actually saw its earnings per share (EPS) drop 0.5% per year.
Given the share price resilience, we don't think the (declining) EPS numbers are a good measure of how the business is moving forward, right now. Therefore, it makes sense to look into other metrics.
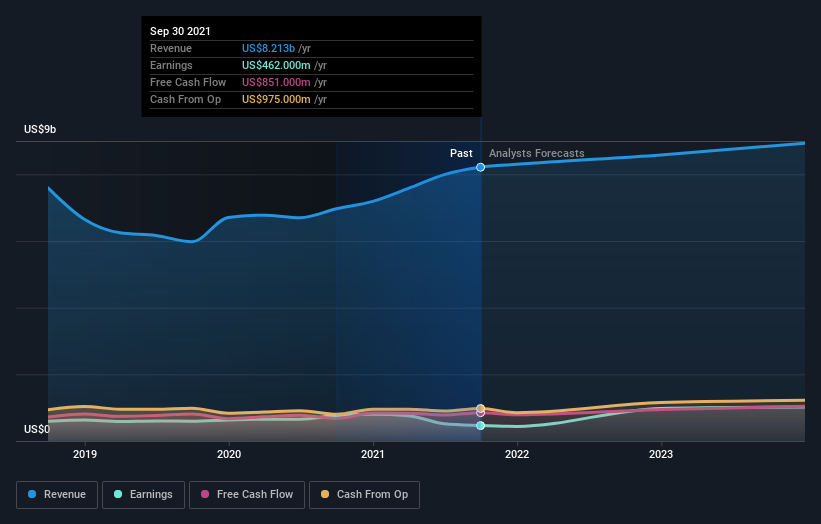
The modest 1.4% dividend yield is unlikely to be propping up the share price. It could be that the revenue growth of 6.5% per year is viewed as evidence that Masco is growing. In that case, the company may be sacrificing current earnings per share to drive growth, and maybe shareholder's faith in better days ahead will be rewarded.
You can see how earnings and revenue have changed over time in the image below (click on the chart to see the exact values).
Masco is well known by investors, and plenty of clever analysts have tried to predict the future profit levels. You can see what analysts are predicting for Masco in this interactive graph of future profit estimates.
What About Dividends?
As well as measuring the share price return, investors should also consider the total shareholder return (TSR). Whereas the share price return only reflects the change in the share price, the TSR includes the value of dividends (assuming they were reinvested) and the benefit of any discounted capital raising or spin-off. Arguably, the TSR gives a more comprehensive picture of the return generated by a stock. In the case of Masco, it has a TSR of 128% for the last 3 years. That exceeds its share price return that we previously mentioned. The dividends paid by the company have thusly boosted the total shareholder return.
A Different Perspective
Masco provided a TSR of 27% over the year (including dividends). That's fairly close to the broader market return. That gain looks pretty satisfying, and it is even better than the five-year TSR of 18% per year. Even if the share price growth slows down from here, there's a good chance that this is business worth watching in the long term. While it is well worth considering the different impacts that market conditions can have on the share price, there are other factors that are even more important. Even so, be aware that Masco is showing 2 warning signs in our investment analysis , you should know about...
Of course, you might find a fantastic investment by looking elsewhere. So take a peek at this free list of companies we expect will grow earnings.
Please note, the market returns quoted in this article reflect the market weighted average returns of stocks that currently trade on US exchanges.
This article by Simply Wall St is general in nature. We provide commentary based on historical data and analyst forecasts only using an unbiased methodology and our articles are not intended to be financial advice. It does not constitute a recommendation to buy or sell any stock, and does not take account of your objectives, or your financial situation. We aim to bring you long-term focused analysis driven by fundamental data. Note that our analysis may not factor in the latest price-sensitive company announcements or qualitative material. Simply Wall St has no position in any stocks mentioned.
Have feedback on this article? Concerned about the content? Get in touch with us directly. Alternatively, email editorial-team (at) simplywallst.com.
