
 Yahoo Finance
 Investing in NatWest Group (LON:NWG) three years ago would have delivered you a 64% gain
By buying an index fund, you can roughly match the market return with ease. But if you choose individual stocks with prowess, you can make superior returns. For example, the NatWest Group plc (LON:NWG) share price is up 29% in the last three years, clearly besting the market decline of around 0.8% (not including dividends). However, more recent returns haven't been as impressive as that, with the stock returning just 8.2% in the last year , including dividends .
So let's investigate and see if the longer term performance of the company has been in line with the underlying business' progress.
See our latest analysis for NatWest Group
There is no denying that markets are sometimes efficient, but prices do not always reflect underlying business performance. One way to examine how market sentiment has changed over time is to look at the interaction between a company's share price and its earnings per share (EPS).
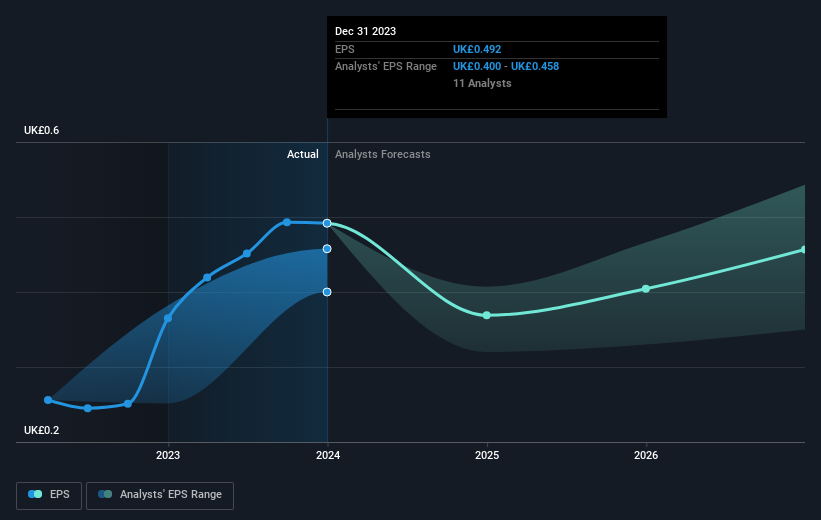
During three years of share price growth, NatWest Group moved from a loss to profitability. So we would expect a higher share price over the period.
You can see below how EPS has changed over time (discover the exact values by clicking on the image).
We consider it positive that insiders have made significant purchases in the last year. Even so, future earnings will be far more important to whether current shareholders make money. Before buying or selling a stock, we always recommend a close examination of historic growth trends, available here..
What About Dividends?
As well as measuring the share price return, investors should also consider the total shareholder return (TSR). Whereas the share price return only reflects the change in the share price, the TSR includes the value of dividends (assuming they were reinvested) and the benefit of any discounted capital raising or spin-off. So for companies that pay a generous dividend, the TSR is often a lot higher than the share price return. As it happens, NatWest Group's TSR for the last 3 years was 64%, which exceeds the share price return mentioned earlier. This is largely a result of its dividend payments!
A Different Perspective
We're pleased to report that NatWest Group shareholders have received a total shareholder return of 8.2% over one year. And that does include the dividend. Since the one-year TSR is better than the five-year TSR (the latter coming in at 8% per year), it would seem that the stock's performance has improved in recent times. In the best case scenario, this may hint at some real business momentum, implying that now could be a great time to delve deeper. While it is well worth considering the different impacts that market conditions can have on the share price, there are other factors that are even more important. For example, we've discovered 2 warning signs for NatWest Group (1 is potentially serious!) that you should be aware of before investing here.
There are plenty of other companies that have insiders buying up shares. You probably do not want to miss this free list of growing companies that insiders are buying.
Please note, the market returns quoted in this article reflect the market weighted average returns of stocks that currently trade on British exchanges.
Have feedback on this article? Concerned about the content? Get in touch with us directly. Alternatively, email editorial-team (at) simplywallst.com.
This article by Simply Wall St is general in nature. We provide commentary based on historical data and analyst forecasts only using an unbiased methodology and our articles are not intended to be financial advice. It does not constitute a recommendation to buy or sell any stock, and does not take account of your objectives, or your financial situation. We aim to bring you long-term focused analysis driven by fundamental data. Note that our analysis may not factor in the latest price-sensitive company announcements or qualitative material. Simply Wall St has no position in any stocks mentioned.
