
 Yahoo Finance
 Investing in NexPoint Real Estate Finance (NYSE:NREF) a year ago would have delivered you a 26% gain
These days it's easy to simply buy an index fund, and your returns should (roughly) match the market. But you can significantly boost your returns by picking above-average stocks. To wit, the NexPoint Real Estate Finance, Inc. (NYSE:NREF) share price is 15% higher than it was a year ago, much better than the market decline of around 15% (not including dividends) in the same period. So that should have shareholders smiling. Note that businesses generally develop over the long term, so the returns over the last year might not reflect a long term trend.
Let's take a look at the underlying fundamentals over the longer term, and see if they've been consistent with shareholders returns.
Check out our latest analysis for NexPoint Real Estate Finance
To paraphrase Benjamin Graham: Over the short term the market is a voting machine, but over the long term it's a weighing machine. One imperfect but simple way to consider how the market perception of a company has shifted is to compare the change in the earnings per share (EPS) with the share price movement.
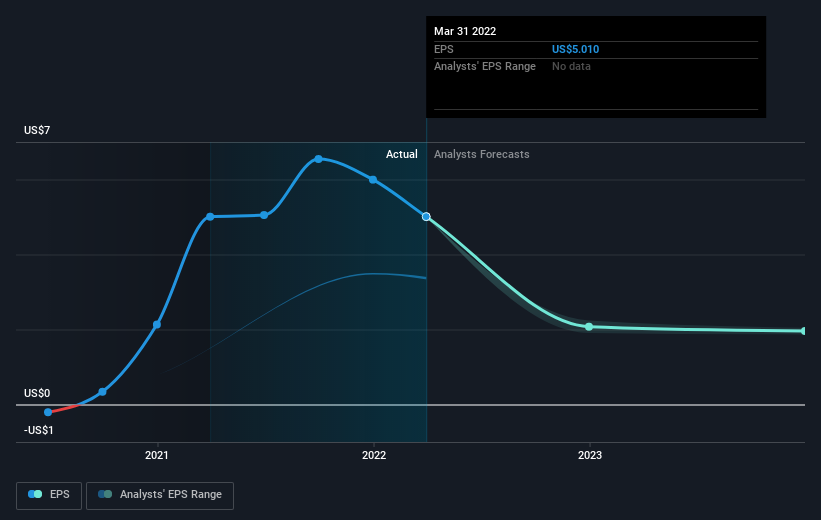
NexPoint Real Estate Finance was able to grow EPS by 0.04% in the last twelve months. This EPS growth is significantly lower than the 15% increase in the share price. So it's fair to assume the market has a higher opinion of the business than it a year ago.
You can see below how EPS has changed over time (discover the exact values by clicking on the image).
We're pleased to report that the CEO is remunerated more modestly than most CEOs at similarly capitalized companies. It's always worth keeping an eye on CEO pay, but a more important question is whether the company will grow earnings throughout the years. This free interactive report on NexPoint Real Estate Finance's earnings, revenue and cash flow is a great place to start, if you want to investigate the stock further.
What About Dividends?
As well as measuring the share price return, investors should also consider the total shareholder return (TSR). The TSR is a return calculation that accounts for the value of cash dividends (assuming that any dividend received was reinvested) and the calculated value of any discounted capital raisings and spin-offs. It's fair to say that the TSR gives a more complete picture for stocks that pay a dividend. As it happens, NexPoint Real Estate Finance's TSR for the last 1 year was 26%, which exceeds the share price return mentioned earlier. And there's no prize for guessing that the dividend payments largely explain the divergence!
A Different Perspective
NexPoint Real Estate Finance shareholders should be happy with the total gain of 26% over the last twelve months, including dividends. We regret to report that the share price is down 3.5% over ninety days. Shorter term share price moves often don't signify much about the business itself. It's always interesting to track share price performance over the longer term. But to understand NexPoint Real Estate Finance better, we need to consider many other factors. Consider for instance, the ever-present spectre of investment risk. We've identified 3 warning signs with NexPoint Real Estate Finance (at least 1 which is significant) , and understanding them should be part of your investment process.
If you like to buy stocks alongside management, then you might just love this free list of companies. (Hint: insiders have been buying them).
Please note, the market returns quoted in this article reflect the market weighted average returns of stocks that currently trade on US exchanges.
Have feedback on this article? Concerned about the content? Get in touch with us directly. Alternatively, email editorial-team (at) simplywallst.com.
This article by Simply Wall St is general in nature. We provide commentary based on historical data and analyst forecasts only using an unbiased methodology and our articles are not intended to be financial advice. It does not constitute a recommendation to buy or sell any stock, and does not take account of your objectives, or your financial situation. We aim to bring you long-term focused analysis driven by fundamental data. Note that our analysis may not factor in the latest price-sensitive company announcements or qualitative material. Simply Wall St has no position in any stocks mentioned.
Join A Paid User Research Session
You’ll receive a US$30 Amazon Gift card for 1 hour of your time while helping us build better investing tools for the individual investors like yourself. Sign up here
