
 Yahoo Finance
 Investing in Northrim BanCorp (NASDAQ:NRIM) five years ago would have delivered you a 75% gain
When you buy and hold a stock for the long term, you definitely want it to provide a positive return. Better yet, you'd like to see the share price move up more than the market average. Unfortunately for shareholders, while the Northrim BanCorp, Inc. (NASDAQ:NRIM) share price is up 42% in the last five years, that's less than the market return. Zooming in, the stock is up a respectable 6.7% in the last year.
Let's take a look at the underlying fundamentals over the longer term, and see if they've been consistent with shareholders returns.
View our latest analysis for Northrim BanCorp
In his essay The Superinvestors of Graham-and-Doddsville Warren Buffett described how share prices do not always rationally reflect the value of a business. By comparing earnings per share (EPS) and share price changes over time, we can get a feel for how investor attitudes to a company have morphed over time.
Over half a decade, Northrim BanCorp managed to grow its earnings per share at 9.7% a year. The EPS growth is more impressive than the yearly share price gain of 7% over the same period. Therefore, it seems the market has become relatively pessimistic about the company. This cautious sentiment is reflected in its (fairly low) P/E ratio of 10.45.
The image below shows how EPS has tracked over time (if you click on the image you can see greater detail).
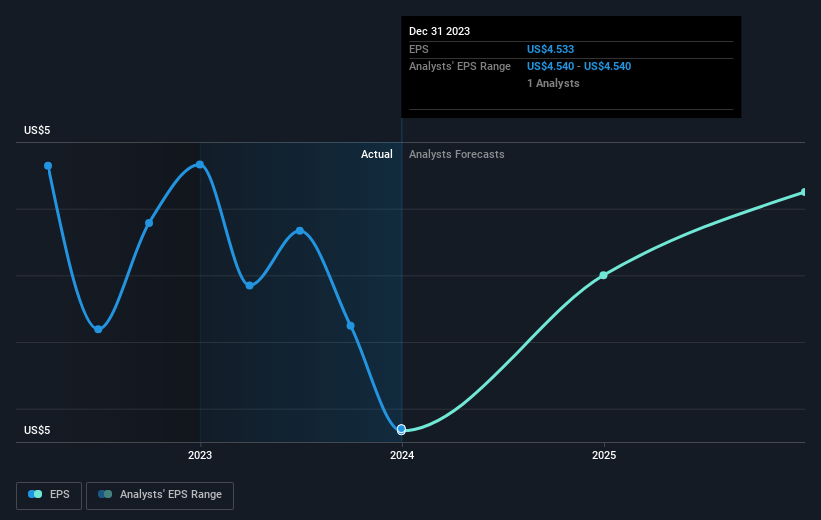
We consider it positive that insiders have made significant purchases in the last year. Having said that, most people consider earnings and revenue growth trends to be a more meaningful guide to the business. Dive deeper into the earnings by checking this interactive graph of Northrim BanCorp's earnings, revenue and cash flow.
What About Dividends?
When looking at investment returns, it is important to consider the difference between total shareholder return (TSR) and share price return. The TSR incorporates the value of any spin-offs or discounted capital raisings, along with any dividends, based on the assumption that the dividends are reinvested. Arguably, the TSR gives a more comprehensive picture of the return generated by a stock. As it happens, Northrim BanCorp's TSR for the last 5 years was 75%, which exceeds the share price return mentioned earlier. This is largely a result of its dividend payments!
A Different Perspective
Northrim BanCorp shareholders gained a total return of 12% during the year. Unfortunately this falls short of the market return. The silver lining is that the gain was actually better than the average annual return of 12% per year over five year. This could indicate that the company is winning over new investors, as it pursues its strategy. It is all well and good that insiders have been buying shares, but we suggest you check here to see what price insiders were buying at.
Northrim BanCorp is not the only stock that insiders are buying. For those who like to find winning investments this free list of growing companies with recent insider purchasing, could be just the ticket.
Please note, the market returns quoted in this article reflect the market weighted average returns of stocks that currently trade on American exchanges.
Have feedback on this article? Concerned about the content? Get in touch with us directly. Alternatively, email editorial-team (at) simplywallst.com.
This article by Simply Wall St is general in nature. We provide commentary based on historical data and analyst forecasts only using an unbiased methodology and our articles are not intended to be financial advice. It does not constitute a recommendation to buy or sell any stock, and does not take account of your objectives, or your financial situation. We aim to bring you long-term focused analysis driven by fundamental data. Note that our analysis may not factor in the latest price-sensitive company announcements or qualitative material. Simply Wall St has no position in any stocks mentioned.
