
 Yahoo Finance
 Investing in Oshkosh (NYSE:OSK) three years ago would have delivered you a 84% gain
Thanks in no small measure to Vanguard founder Jack Bogle, it's easy buy a low cost index fund, which should provide the average market return. But you can make better returns by buying undervalued shares. Notably, the Oshkosh Corporation (NYSE:OSK) share price has gained 77% in three years, which is better than the average market return. It's nice to see the stock price has more recent momentum, too, with a rise of 26% in the last year.
So let's assess the underlying fundamentals over the last 3 years and see if they've moved in lock-step with shareholder returns.
Check out our latest analysis for Oshkosh
In his essay The Superinvestors of Graham-and-Doddsville Warren Buffett described how share prices do not always rationally reflect the value of a business. By comparing earnings per share (EPS) and share price changes over time, we can get a feel for how investor attitudes to a company have morphed over time.
During three years of share price growth, Oshkosh achieved compound earnings per share growth of 2.5% per year. In comparison, the 21% per year gain in the share price outpaces the EPS growth. This indicates that the market is feeling more optimistic on the stock, after the last few years of progress. It's not unusual to see the market 're-rate' a stock, after a few years of growth.
The image below shows how EPS has tracked over time (if you click on the image you can see greater detail).
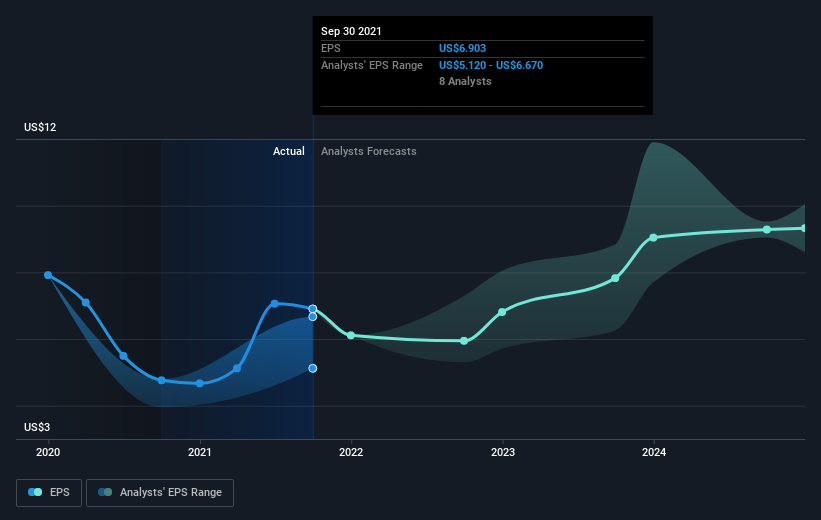
We know that Oshkosh has improved its bottom line lately, but is it going to grow revenue? Check if analysts think Oshkosh will grow revenue in the future.
What About Dividends?
It is important to consider the total shareholder return, as well as the share price return, for any given stock. Whereas the share price return only reflects the change in the share price, the TSR includes the value of dividends (assuming they were reinvested) and the benefit of any discounted capital raising or spin-off. Arguably, the TSR gives a more comprehensive picture of the return generated by a stock. As it happens, Oshkosh's TSR for the last 3 years was 84%, which exceeds the share price return mentioned earlier. This is largely a result of its dividend payments!
A Different Perspective
It's nice to see that Oshkosh shareholders have received a total shareholder return of 27% over the last year. And that does include the dividend. That's better than the annualised return of 12% over half a decade, implying that the company is doing better recently. In the best case scenario, this may hint at some real business momentum, implying that now could be a great time to delve deeper. I find it very interesting to look at share price over the long term as a proxy for business performance. But to truly gain insight, we need to consider other information, too. Even so, be aware that Oshkosh is showing 1 warning sign in our investment analysis , you should know about...
For those who like to find winning investments this free list of growing companies with recent insider purchasing, could be just the ticket.
Please note, the market returns quoted in this article reflect the market weighted average returns of stocks that currently trade on US exchanges.
Have feedback on this article? Concerned about the content? Get in touch with us directly. Alternatively, email editorial-team (at) simplywallst.com.
This article by Simply Wall St is general in nature. We provide commentary based on historical data and analyst forecasts only using an unbiased methodology and our articles are not intended to be financial advice. It does not constitute a recommendation to buy or sell any stock, and does not take account of your objectives, or your financial situation. We aim to bring you long-term focused analysis driven by fundamental data. Note that our analysis may not factor in the latest price-sensitive company announcements or qualitative material. Simply Wall St has no position in any stocks mentioned.
