
 Yahoo Finance
 Investing in PotlatchDeltic (NASDAQ:PCH) three years ago would have delivered you a 45% gain
It might be of some concern to shareholders to see the PotlatchDeltic Corporation (NASDAQ:PCH) share price down 15% in the last month. On the other hand the share price is higher than it was three years ago. In that time, it is up 22%, which isn't bad, but not amazing either.
Now it's worth having a look at the company's fundamentals too, because that will help us determine if the long term shareholder return has matched the performance of the underlying business.
See our latest analysis for PotlatchDeltic
While the efficient markets hypothesis continues to be taught by some, it has been proven that markets are over-reactive dynamic systems, and investors are not always rational. One way to examine how market sentiment has changed over time is to look at the interaction between a company's share price and its earnings per share (EPS).
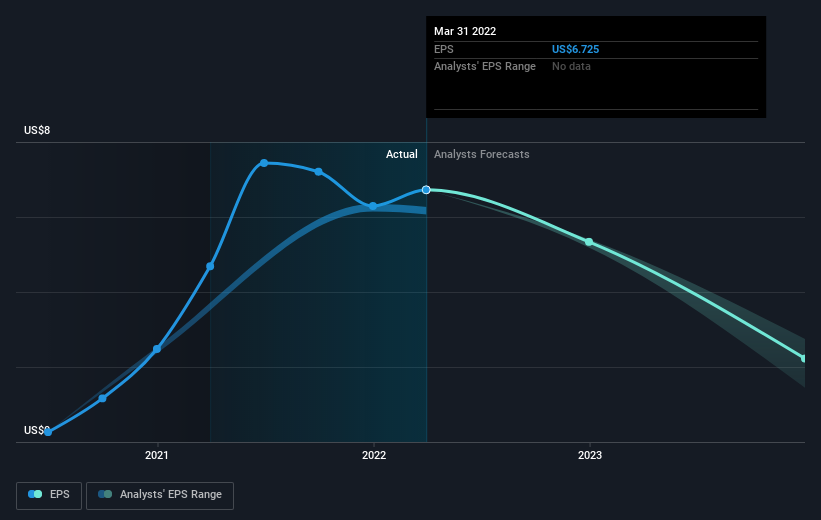
PotlatchDeltic was able to grow its EPS at 55% per year over three years, sending the share price higher. This EPS growth is higher than the 7% average annual increase in the share price. Therefore, it seems the market has moderated its expectations for growth, somewhat. We'd venture the lowish P/E ratio of 6.88 also reflects the negative sentiment around the stock.
You can see below how EPS has changed over time (discover the exact values by clicking on the image).
We know that PotlatchDeltic has improved its bottom line over the last three years, but what does the future have in store? Take a more thorough look at PotlatchDeltic's financial health with this free report on its balance sheet.
What About Dividends?
When looking at investment returns, it is important to consider the difference between total shareholder return (TSR) and share price return. The TSR is a return calculation that accounts for the value of cash dividends (assuming that any dividend received was reinvested) and the calculated value of any discounted capital raisings and spin-offs. So for companies that pay a generous dividend, the TSR is often a lot higher than the share price return. We note that for PotlatchDeltic the TSR over the last 3 years was 45%, which is better than the share price return mentioned above. This is largely a result of its dividend payments!
A Different Perspective
Although it hurts that PotlatchDeltic returned a loss of 3.8% in the last twelve months, the broader market was actually worse, returning a loss of 20%. Longer term investors wouldn't be so upset, since they would have made 7%, each year, over five years. It could be that the business is just facing some short term problems, but shareholders should keep a close eye on the fundamentals. While it is well worth considering the different impacts that market conditions can have on the share price, there are other factors that are even more important. For example, we've discovered 4 warning signs for PotlatchDeltic (1 can't be ignored!) that you should be aware of before investing here.
If you are like me, then you will not want to miss this free list of growing companies that insiders are buying.
Please note, the market returns quoted in this article reflect the market weighted average returns of stocks that currently trade on US exchanges.
Have feedback on this article? Concerned about the content? Get in touch with us directly. Alternatively, email editorial-team (at) simplywallst.com.
This article by Simply Wall St is general in nature. We provide commentary based on historical data and analyst forecasts only using an unbiased methodology and our articles are not intended to be financial advice. It does not constitute a recommendation to buy or sell any stock, and does not take account of your objectives, or your financial situation. We aim to bring you long-term focused analysis driven by fundamental data. Note that our analysis may not factor in the latest price-sensitive company announcements or qualitative material. Simply Wall St has no position in any stocks mentioned.
