
 Yahoo Finance
 Investing In Property Through Residential Secure Income plc (LON:RESI)

Residential Secure Income plc is a UK£159m small-cap, real estate investment trust (REIT) based in London, United Kingdom. REIT shares give you ownership of the company than owns and manages various income-producing property, whether it be commercial, industrial or residential. The structure of RESI is unique and it has to adhere to different requirements compared to other non-REIT stocks. I’ll take you through some of the key metrics you should use in order to properly assess RESI.
View our latest analysis for Residential Secure Income
REIT investors should be familiar with the term Fund from Operations (FFO) – a REIT’s main source of cash flow from its day-to-day business activities. FFO is a higher quality measure of earnings because it takes out the impact of non-recurring sales and non-cash items such as depreciation. These items can distort the bottom line and not necessarily reflective of RESI’s daily operations. For RESI, its FFO of UK£3.7m makes up 132% of its gross profit, which means the majority of its earnings are high-quality and recurring.
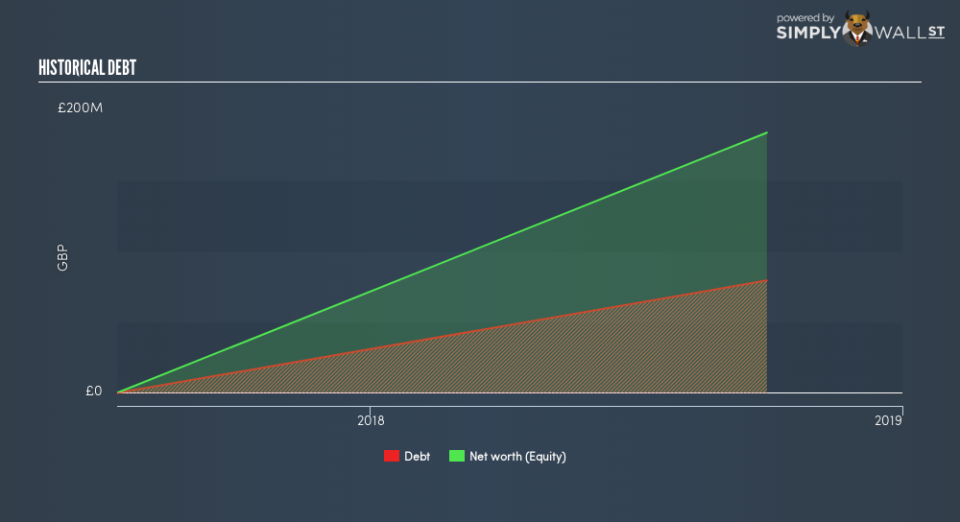
Robust financial health can be measured using a common metric in the REIT investing world, FFO-to-debt. The calculation roughly estimates how long it will take for RESI to repay debt on its balance sheet, which gives us insight into how much risk is associated with having that level of debt on its books. With a ratio of 4.7%, the credit rating agency Standard & Poor would consider this as aggressive risk. This would take RESI 21.27 years to pay off using just operating income, which is a long time, and risk increases with time. But realistically, companies have many levers to pull in order to pay back their debt, beyond operating income alone.
Next, interest coverage ratio shows how many times RESI’s earnings can cover its annual interest payments. Usually the ratio is calculated using EBIT, but for REITs, it’s better to use FFO divided by net interest. This is similar to the above concept, but looks at the nearer-term obligations. With an interest coverage ratio of 3.58x, it’s safe to say RESI is generating an appropriate amount of cash from its borrowings.
In terms of valuing RESI, FFO can also be used as a form of relative valuation. Instead of the P/E ratio, P/FFO is used instead, which is very common for REIT stocks. In RESI’s case its P/FFO is 43.23x, compared to the long-term industry average of 16.5x, meaning that it is highly overvalued.
Next Steps:
As a REIT, Residential Secure Income offers some unique characteristics which could help diversify your portfolio. However, before you decide on whether or not to invest in RESI, I highly recommend taking a look at other aspects of the stock to consider:
Future Outlook: What are well-informed industry analysts predicting for RESI’s future growth? Take a look at our free research report of analyst consensus for RESI’s outlook.
Valuation: What is RESI worth today? Is the stock undervalued, even when its growth outlook is factored into its intrinsic value? The intrinsic value infographic in our free research report helps visualize whether RESI is currently mispriced by the market.
Other High-Performing Stocks: Are there other stocks that provide better prospects with proven track records? Explore our free list of these great stocks here.
To help readers see past the short term volatility of the financial market, we aim to bring you a long-term focused research analysis purely driven by fundamental data. Note that our analysis does not factor in the latest price-sensitive company announcements.
The author is an independent contributor and at the time of publication had no position in the stocks mentioned. For errors that warrant correction please contact the editor at editorial-team@simplywallst.com.
