
 Yahoo Finance
 Investing In Property Through Standard Life Investments Property Income Trust Limited (LON:SLI)

Standard Life Investments Property Income Trust Limited is a UK£354m small-cap, real estate investment trust (REIT) based in Saint Peter Port, Channel Islands. REITs own and operate income-generating property and adhere to a different set of regulations. This impacts how SLI’s business operates and also how we should analyse its stock. Below, I'll look at a few important metrics to keep in mind as part of your research on SLI.
Check out our latest analysis for Standard Life Investments Property Income Trust
Funds from Operations (FFO) is a higher quality measure of SLI's earnings compared to net income. This term is very common in the REIT investing world as it provides a cleaner look at its cash flow from daily operations by excluding impact of one-off activities or non-cash items such as depreciation. For SLI, its FFO of UK£37m makes up 163% of its gross profit, which means the majority of its earnings are high-quality and recurring.
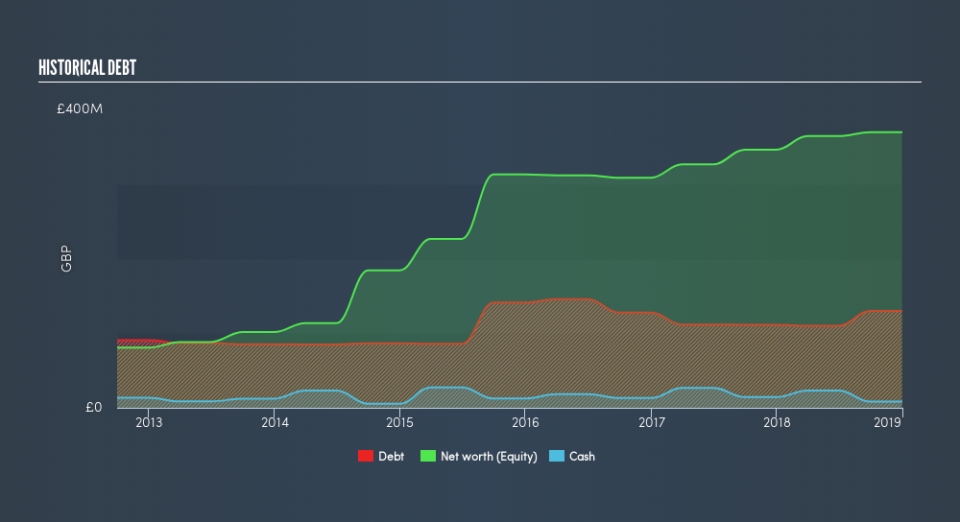
Robust financial health can be measured using a common metric in the REIT investing world, FFO-to-debt. The calculation roughly estimates how long it will take for SLI to repay debt on its balance sheet, which gives us insight into how much risk is associated with having that level of debt on its books. With a ratio of 29%, the credit rating agency Standard & Poor would consider this as aggressive risk. This would take SLI 3.47 years to pay off using operating income alone, which is reasonable, given that long term debt is a multi-year commitment.
Next, interest coverage ratio shows how many times SLI’s earnings can cover its annual interest payments. Usually the ratio is calculated using EBIT, but for REITs, it’s better to use FFO divided by net interest. This is similar to the above concept, but looks at the nearer-term obligations. With an interest coverage ratio of 10.8x, its safe to say SLI is producing more than enough funds to cover its upcoming payments.
I also use FFO to look at SLI's valuation relative to other REITs in Channel Islands by using the price-to-FFO metric. This is conceptually the same as the price-to-earnings (PE) ratio, but as previously mentioned, FFO is more suitable. In SLI’s case its P/FFO is 9.45x, compared to the long-term industry average of 16.5x, meaning that it is undervalued.
Next Steps:
As a REIT, Standard Life Investments Property Income Trust offers some unique characteristics which could help diversify your portfolio. However, before you decide on whether or not to invest in SLI, I highly recommend taking a look at other aspects of the stock to consider:
Future Outlook: What are well-informed industry analysts predicting for SLI’s future growth? Take a look at our free research report of analyst consensus for SLI’s outlook.
Valuation: What is SLI worth today? Is the stock undervalued, even when its growth outlook is factored into its intrinsic value? The intrinsic value infographic in our free research report helps visualize whether SLI is currently mispriced by the market.
Other High-Performing Stocks: Are there other stocks that provide better prospects with proven track records? Explore our free list of these great stocks here.
We aim to bring you long-term focused research analysis driven by fundamental data. Note that our analysis may not factor in the latest price-sensitive company announcements or qualitative material.
If you spot an error that warrants correction, please contact the editor at editorial-team@simplywallst.com. This article by Simply Wall St is general in nature. It does not constitute a recommendation to buy or sell any stock, and does not take account of your objectives, or your financial situation. Simply Wall St has no position in the stocks mentioned. Thank you for reading.
