
 Yahoo Finance
 Investing in Rockhopper Exploration (LON:RKH) a year ago would have delivered you a 91% gain
Rockhopper Exploration plc (LON:RKH) shareholders have seen the share price descend 27% over the month. While that might be a setback, it doesn't negate the nice returns received over the last twelve months. After all, the share price is up a market-beating 91% in that time.
So let's assess the underlying fundamentals over the last 1 year and see if they've moved in lock-step with shareholder returns.
View our latest analysis for Rockhopper Exploration
We don't think Rockhopper Exploration's revenue of US$1,015,000 is enough to establish significant demand. So it seems that the investors focused more on what could be, than paying attention to the current revenues (or lack thereof). For example, they may be hoping that Rockhopper Exploration finds fossil fuels with an exploration program, before it runs out of money.
Companies that lack both meaningful revenue and profits are usually considered high risk. You should be aware that there is always a chance that this sort of company will need to issue more shares to raise money to continue pursuing its business plan. While some companies like this go on to deliver on their plan, making good money for shareholders, many end in painful losses and eventual de-listing. Rockhopper Exploration has already given some investors a taste of the sweet gains that high risk investing can generate, if your timing is right.
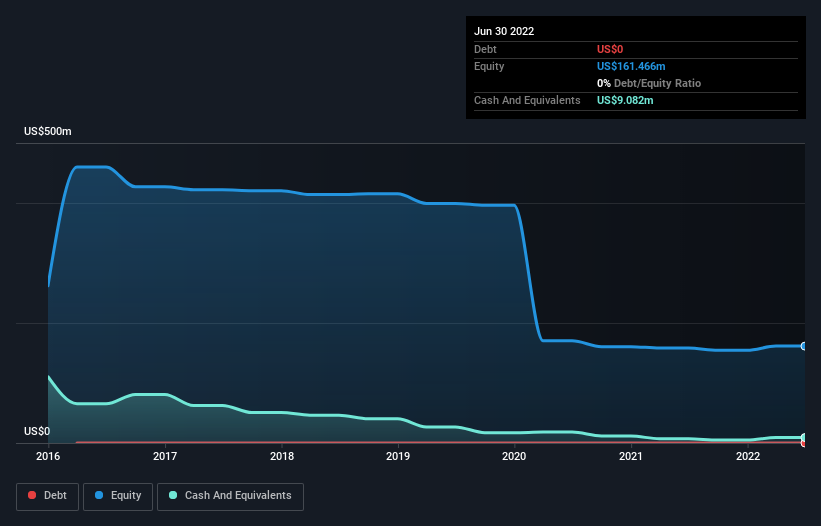
Rockhopper Exploration had liabilities exceeding cash by US$93m when it last reported in June 2022, according to our data. That puts it in the highest risk category, according to our analysis. So we're surprised to see the stock up 104% in the last year , but we're happy for holders. It's clear more than a few people believe in the potential. You can click on the image below to see (in greater detail) how Rockhopper Exploration's cash levels have changed over time.
In reality it's hard to have much certainty when valuing a business that has neither revenue or profit. Given that situation, many of the best investors like to check if insiders have been buying shares. If they are buying a significant amount of shares, that's certainly a good thing. You can click here to see if there are insiders buying.
A Different Perspective
It's nice to see that Rockhopper Exploration shareholders have received a total shareholder return of 91% over the last year. There's no doubt those recent returns are much better than the TSR loss of 9% per year over five years. The long term loss makes us cautious, but the short term TSR gain certainly hints at a brighter future. While it is well worth considering the different impacts that market conditions can have on the share price, there are other factors that are even more important. For example, we've discovered 5 warning signs for Rockhopper Exploration (2 make us uncomfortable!) that you should be aware of before investing here.
If you would prefer to check out another company -- one with potentially superior financials -- then do not miss this free list of companies that have proven they can grow earnings.
Please note, the market returns quoted in this article reflect the market weighted average returns of stocks that currently trade on GB exchanges.
Have feedback on this article? Concerned about the content? Get in touch with us directly. Alternatively, email editorial-team (at) simplywallst.com.
This article by Simply Wall St is general in nature. We provide commentary based on historical data and analyst forecasts only using an unbiased methodology and our articles are not intended to be financial advice. It does not constitute a recommendation to buy or sell any stock, and does not take account of your objectives, or your financial situation. We aim to bring you long-term focused analysis driven by fundamental data. Note that our analysis may not factor in the latest price-sensitive company announcements or qualitative material. Simply Wall St has no position in any stocks mentioned.
Join A Paid User Research Session
You’ll receive a US$30 Amazon Gift card for 1 hour of your time while helping us build better investing tools for the individual investors like yourself. Sign up here
