
 Yahoo Finance
 Investing in Roebuck Food Group (LON:RFG) three years ago would have delivered you a 150% gain
One of the frustrations of investing is when a stock goes down. But when the market is down, you're bound to have some losers. The Roebuck Food Group plc (LON:RFG) is down 87% over three years, but the total shareholder return is 150% once you include the dividend. That's better than the market which returned 17% over the last three years. We really feel for shareholders in this scenario. It's a good reminder of the importance of diversification, and it's worth keeping in mind there's more to life than money, anyway.
It's worthwhile assessing if the company's economics have been moving in lockstep with these underwhelming shareholder returns, or if there is some disparity between the two. So let's do just that.
See our latest analysis for Roebuck Food Group
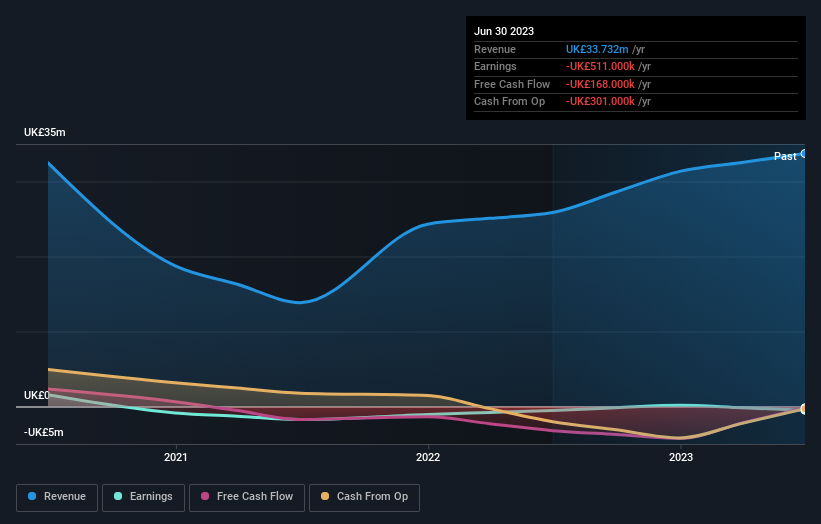
Roebuck Food Group wasn't profitable in the last twelve months, it is unlikely we'll see a strong correlation between its share price and its earnings per share (EPS). Arguably revenue is our next best option. Shareholders of unprofitable companies usually expect strong revenue growth. That's because fast revenue growth can be easily extrapolated to forecast profits, often of considerable size.
In the last three years, Roebuck Food Group saw its revenue grow by 16% per year, compound. That's a pretty good rate of top-line growth. So it seems unlikely the 23% share price drop (each year) is entirely about the revenue. More likely, the market was spooked by the cost of that revenue. This is exactly why investors need to diversify - even when a loss making company grows revenue, it can fail to deliver for shareholders.
You can see below how earnings and revenue have changed over time (discover the exact values by clicking on the image).
Take a more thorough look at Roebuck Food Group's financial health with this free report on its balance sheet.
What About The Total Shareholder Return (TSR)?
We've already covered Roebuck Food Group's share price action, but we should also mention its total shareholder return (TSR). The TSR is a return calculation that accounts for the value of cash dividends (assuming that any dividend received was reinvested) and the calculated value of any discounted capital raisings and spin-offs. Roebuck Food Group hasn't been paying dividends, but its TSR of 150% exceeds its share price return of -87%, implying it has either spun-off a business, or raised capital at a discount; thereby providing additional value to shareholders.
A Different Perspective
We're pleased to report that Roebuck Food Group shareholders have received a total shareholder return of 7.7% over one year. Having said that, the five-year TSR of 35% a year, is even better. The pessimistic view would be that be that the stock has its best days behind it, but on the other hand the price might simply be moderating while the business itself continues to execute. I find it very interesting to look at share price over the long term as a proxy for business performance. But to truly gain insight, we need to consider other information, too. For example, we've discovered 3 warning signs for Roebuck Food Group that you should be aware of before investing here.
Of course Roebuck Food Group may not be the best stock to buy. So you may wish to see this free collection of growth stocks.
Please note, the market returns quoted in this article reflect the market weighted average returns of stocks that currently trade on British exchanges.
Have feedback on this article? Concerned about the content? Get in touch with us directly. Alternatively, email editorial-team (at) simplywallst.com.
This article by Simply Wall St is general in nature. We provide commentary based on historical data and analyst forecasts only using an unbiased methodology and our articles are not intended to be financial advice. It does not constitute a recommendation to buy or sell any stock, and does not take account of your objectives, or your financial situation. We aim to bring you long-term focused analysis driven by fundamental data. Note that our analysis may not factor in the latest price-sensitive company announcements or qualitative material. Simply Wall St has no position in any stocks mentioned.
