
 Yahoo Finance
 Investing in Ryman Hospitality Properties (NYSE:RHP) five years ago would have delivered you a 34% gain
It hasn't been the best quarter for Ryman Hospitality Properties, Inc. (NYSE:RHP) shareholders, since the share price has fallen 17% in that time. But the silver lining is the stock is up over five years. In that time, it is up 17%, which isn't bad, but is below the market return of 68%.
Let's take a look at the underlying fundamentals over the longer term, and see if they've been consistent with shareholders returns.
Check out our latest analysis for Ryman Hospitality Properties
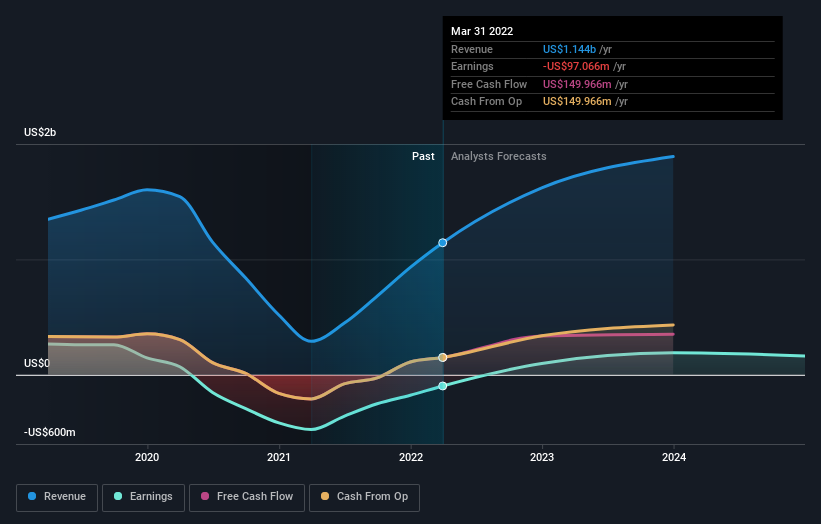
Ryman Hospitality Properties wasn't profitable in the last twelve months, it is unlikely we'll see a strong correlation between its share price and its earnings per share (EPS). Arguably revenue is our next best option. When a company doesn't make profits, we'd generally expect to see good revenue growth. As you can imagine, fast revenue growth, when maintained, often leads to fast profit growth.
In the last 5 years Ryman Hospitality Properties saw its revenue shrink by 10% per year. The falling revenue is arguably somewhat reflected in the lacklustre return of 3% per year over that time. That's pretty decent given the top line decline, and lack of profits. We'd keep an eye on changes in the trend - there may be an opportunity if the company returns to growth.
The image below shows how earnings and revenue have tracked over time (if you click on the image you can see greater detail).
If you are thinking of buying or selling Ryman Hospitality Properties stock, you should check out this FREE detailed report on its balance sheet.
What about the Total Shareholder Return (TSR)?
We've already covered Ryman Hospitality Properties' share price action, but we should also mention its total shareholder return (TSR). Arguably the TSR is a more complete return calculation because it accounts for the value of dividends (as if they were reinvested), along with the hypothetical value of any discounted capital that have been offered to shareholders. Ryman Hospitality Properties' TSR of 34% for the 5 years exceeded its share price return, because it has paid dividends.
A Different Perspective
While it's never nice to take a loss, Ryman Hospitality Properties shareholders can take comfort that their trailing twelve month loss of 7.5% wasn't as bad as the market loss of around 17%. Longer term investors wouldn't be so upset, since they would have made 6%, each year, over five years. In the best case scenario the last year is just a temporary blip on the journey to a brighter future. I find it very interesting to look at share price over the long term as a proxy for business performance. But to truly gain insight, we need to consider other information, too. Consider risks, for instance. Every company has them, and we've spotted 2 warning signs for Ryman Hospitality Properties you should know about.
If you would prefer to check out another company -- one with potentially superior financials -- then do not miss this free list of companies that have proven they can grow earnings.
Please note, the market returns quoted in this article reflect the market weighted average returns of stocks that currently trade on US exchanges.
Have feedback on this article? Concerned about the content? Get in touch with us directly. Alternatively, email editorial-team (at) simplywallst.com.
This article by Simply Wall St is general in nature. We provide commentary based on historical data and analyst forecasts only using an unbiased methodology and our articles are not intended to be financial advice. It does not constitute a recommendation to buy or sell any stock, and does not take account of your objectives, or your financial situation. We aim to bring you long-term focused analysis driven by fundamental data. Note that our analysis may not factor in the latest price-sensitive company announcements or qualitative material. Simply Wall St has no position in any stocks mentioned.
Join A Paid User Research Session
You’ll receive a US$30 Amazon Gift card for 1 hour of your time while helping us build better investing tools for the individual investors like yourself. Sign up here
