
 Yahoo Finance
 Investing in SciDev (ASX:SDV) three years ago would have delivered you a 599% gain
Some SciDev Limited (ASX:SDV) shareholders are probably rather concerned to see the share price fall 32% over the last three months. But that doesn't displace its brilliant performance over three years. The longer term view reveals that the share price is up 550% in that period. So the recent fall doesn't do much to dampen our respect for the business. The share price action could signify that the business itself is dramatically improved, in that time. It really delights us to see such great share price performance for investors.
So let's investigate and see if the longer term performance of the company has been in line with the underlying business' progress.
Check out our latest analysis for SciDev
To quote Buffett, 'Ships will sail around the world but the Flat Earth Society will flourish. There will continue to be wide discrepancies between price and value in the marketplace...' One flawed but reasonable way to assess how sentiment around a company has changed is to compare the earnings per share (EPS) with the share price.
SciDev became profitable within the last three years. Given the importance of this milestone, it's not overly surprising that the share price has increased strongly.
The graphic below depicts how EPS has changed over time (unveil the exact values by clicking on the image).
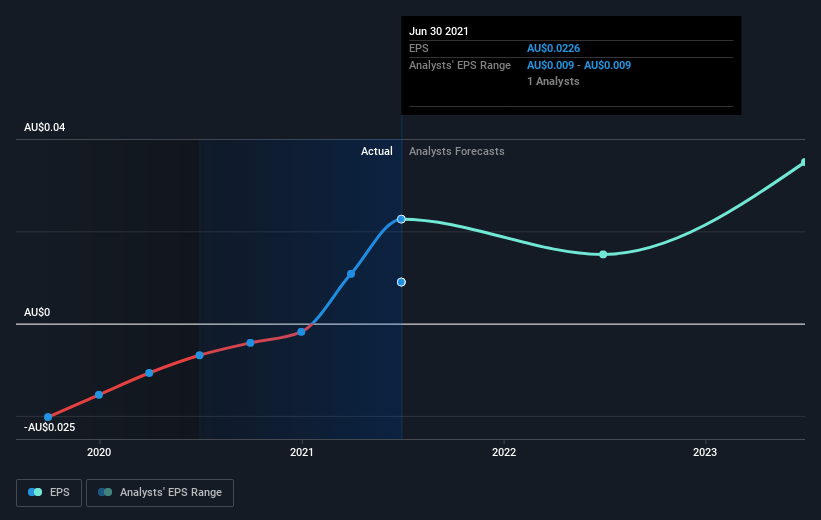
We know that SciDev has improved its bottom line lately, but is it going to grow revenue? You could check out this free report showing analyst revenue forecasts.
What about the Total Shareholder Return (TSR)?
We've already covered SciDev's share price action, but we should also mention its total shareholder return (TSR). Arguably the TSR is a more complete return calculation because it accounts for the value of dividends (as if they were reinvested), along with the hypothetical value of any discounted capital that have been offered to shareholders. We note that SciDev's TSR, at 599% is higher than its share price return of 550%. When you consider it hasn't been paying a dividend, this data suggests shareholders have benefitted from a spin-off, or had the opportunity to acquire attractively priced shares in a discounted capital raising.
A Different Perspective
Investors in SciDev had a tough year, with a total loss of 18%, against a market gain of about 27%. Even the share prices of good stocks drop sometimes, but we want to see improvements in the fundamental metrics of a business, before getting too interested. On the bright side, long term shareholders have made money, with a gain of 42% per year over half a decade. If the fundamental data continues to indicate long term sustainable growth, the current sell-off could be an opportunity worth considering. I find it very interesting to look at share price over the long term as a proxy for business performance. But to truly gain insight, we need to consider other information, too. For instance, we've identified 4 warning signs for SciDev (1 is concerning) that you should be aware of.
Of course SciDev may not be the best stock to buy. So you may wish to see this free collection of growth stocks.
Please note, the market returns quoted in this article reflect the market weighted average returns of stocks that currently trade on AU exchanges.
This article by Simply Wall St is general in nature. We provide commentary based on historical data and analyst forecasts only using an unbiased methodology and our articles are not intended to be financial advice. It does not constitute a recommendation to buy or sell any stock, and does not take account of your objectives, or your financial situation. We aim to bring you long-term focused analysis driven by fundamental data. Note that our analysis may not factor in the latest price-sensitive company announcements or qualitative material. Simply Wall St has no position in any stocks mentioned.
Have feedback on this article? Concerned about the content? Get in touch with us directly. Alternatively, email editorial-team (at) simplywallst.com.
