
 Yahoo Finance
 Investing in Southern Cross Electrical Engineering (ASX:SXE) three years ago would have delivered you a 172% gain
The most you can lose on any stock (assuming you don't use leverage) is 100% of your money. But if you buy shares in a really great company, you can more than double your money. For example, the Southern Cross Electrical Engineering Limited (ASX:SXE) share price has soared 122% in the last three years. That sort of return is as solid as granite. Also pleasing for shareholders was the 33% gain in the last three months.
Now it's worth having a look at the company's fundamentals too, because that will help us determine if the long term shareholder return has matched the performance of the underlying business.
View our latest analysis for Southern Cross Electrical Engineering
To paraphrase Benjamin Graham: Over the short term the market is a voting machine, but over the long term it's a weighing machine. One imperfect but simple way to consider how the market perception of a company has shifted is to compare the change in the earnings per share (EPS) with the share price movement.
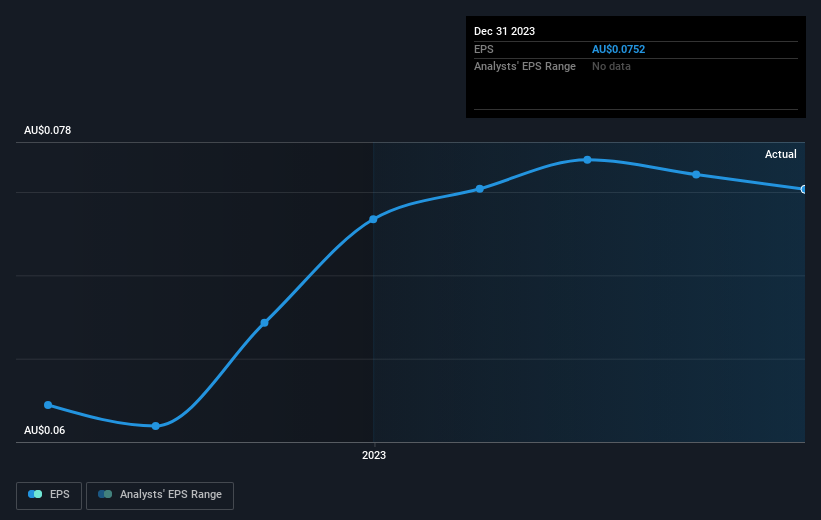
During three years of share price growth, Southern Cross Electrical Engineering achieved compound earnings per share growth of 24% per year. In comparison, the 30% per year gain in the share price outpaces the EPS growth. This indicates that the market is feeling more optimistic on the stock, after the last few years of progress. It's not unusual to see the market 're-rate' a stock, after a few years of growth.
You can see how EPS has changed over time in the image below (click on the chart to see the exact values).
Dive deeper into Southern Cross Electrical Engineering's key metrics by checking this interactive graph of Southern Cross Electrical Engineering's earnings, revenue and cash flow.
What About Dividends?
As well as measuring the share price return, investors should also consider the total shareholder return (TSR). The TSR is a return calculation that accounts for the value of cash dividends (assuming that any dividend received was reinvested) and the calculated value of any discounted capital raisings and spin-offs. Arguably, the TSR gives a more comprehensive picture of the return generated by a stock. In the case of Southern Cross Electrical Engineering, it has a TSR of 172% for the last 3 years. That exceeds its share price return that we previously mentioned. This is largely a result of its dividend payments!
A Different Perspective
It's good to see that Southern Cross Electrical Engineering has rewarded shareholders with a total shareholder return of 87% in the last twelve months. Of course, that includes the dividend. Since the one-year TSR is better than the five-year TSR (the latter coming in at 23% per year), it would seem that the stock's performance has improved in recent times. In the best case scenario, this may hint at some real business momentum, implying that now could be a great time to delve deeper. I find it very interesting to look at share price over the long term as a proxy for business performance. But to truly gain insight, we need to consider other information, too. For instance, we've identified 1 warning sign for Southern Cross Electrical Engineering that you should be aware of.
We will like Southern Cross Electrical Engineering better if we see some big insider buys. While we wait, check out this free list of growing companies with considerable, recent, insider buying.
Please note, the market returns quoted in this article reflect the market weighted average returns of stocks that currently trade on Australian exchanges.
Have feedback on this article? Concerned about the content? Get in touch with us directly. Alternatively, email editorial-team (at) simplywallst.com.
This article by Simply Wall St is general in nature. We provide commentary based on historical data and analyst forecasts only using an unbiased methodology and our articles are not intended to be financial advice. It does not constitute a recommendation to buy or sell any stock, and does not take account of your objectives, or your financial situation. We aim to bring you long-term focused analysis driven by fundamental data. Note that our analysis may not factor in the latest price-sensitive company announcements or qualitative material. Simply Wall St has no position in any stocks mentioned.
