
 Yahoo Finance
 Investor Optimism Abounds Norman Broadbent plc (LON:NBB) But Growth Is Lacking
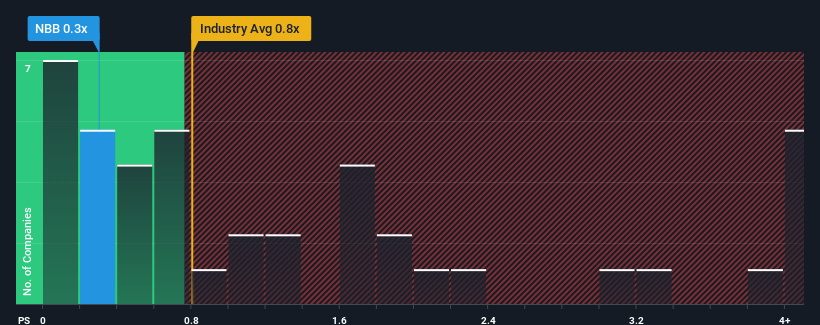
With a median price-to-sales (or "P/S") ratio of close to 0.8x in the Professional Services industry in the United Kingdom, you could be forgiven for feeling indifferent about Norman Broadbent plc's (LON:NBB) P/S ratio of 0.3x. While this might not raise any eyebrows, if the P/S ratio is not justified investors could be missing out on a potential opportunity or ignoring looming disappointment.
View our latest analysis for Norman Broadbent
How Norman Broadbent Has Been Performing
With revenue growth that's exceedingly strong of late, Norman Broadbent has been doing very well. Perhaps the market is expecting future revenue performance to taper off, which has kept the P/S from rising. Those who are bullish on Norman Broadbent will be hoping that this isn't the case, so that they can pick up the stock at a lower valuation.
Want the full picture on earnings, revenue and cash flow for the company? Then our free report on Norman Broadbent will help you shine a light on its historical performance.
Is There Some Revenue Growth Forecasted For Norman Broadbent?
In order to justify its P/S ratio, Norman Broadbent would need to produce growth that's similar to the industry.
Retrospectively, the last year delivered an exceptional 46% gain to the company's top line. Although, its longer-term performance hasn't been as strong with three-year revenue growth being relatively non-existent overall. So it appears to us that the company has had a mixed result in terms of growing revenue over that time.
Comparing the recent medium-term revenue trends against the industry's one-year growth forecast of 4.0% shows it's noticeably less attractive.
With this in mind, we find it intriguing that Norman Broadbent's P/S is comparable to that of its industry peers. It seems most investors are ignoring the fairly limited recent growth rates and are willing to pay up for exposure to the stock. They may be setting themselves up for future disappointment if the P/S falls to levels more in line with recent growth rates.
The Key Takeaway
Generally, our preference is to limit the use of the price-to-sales ratio to establishing what the market thinks about the overall health of a company.
We've established that Norman Broadbent's average P/S is a bit surprising since its recent three-year growth is lower than the wider industry forecast. Right now we are uncomfortable with the P/S as this revenue performance isn't likely to support a more positive sentiment for long. If recent medium-term revenue trends continue, the probability of a share price decline will become quite substantial, placing shareholders at risk.
You should always think about risks. Case in point, we've spotted 1 warning sign for Norman Broadbent you should be aware of.
Of course, profitable companies with a history of great earnings growth are generally safer bets. So you may wish to see this free collection of other companies that have reasonable P/E ratios and have grown earnings strongly.
Have feedback on this article? Concerned about the content? Get in touch with us directly. Alternatively, email editorial-team (at) simplywallst.com.
This article by Simply Wall St is general in nature. We provide commentary based on historical data and analyst forecasts only using an unbiased methodology and our articles are not intended to be financial advice. It does not constitute a recommendation to buy or sell any stock, and does not take account of your objectives, or your financial situation. We aim to bring you long-term focused analysis driven by fundamental data. Note that our analysis may not factor in the latest price-sensitive company announcements or qualitative material. Simply Wall St has no position in any stocks mentioned.
