
 Yahoo Finance
 Investors in Admiral Group (LON:ADM) have unfortunately lost 15% over the last year
Investors can approximate the average market return by buying an index fund. Active investors aim to buy stocks that vastly outperform the market - but in the process, they risk under-performance. That downside risk was realized by Admiral Group plc (LON:ADM) shareholders over the last year, as the share price declined 22%. That's well below the market decline of 0.7%. The silver lining (for longer term investors) is that the stock is still 11% higher than it was three years ago. It's down 25% in about a quarter.
With that in mind, it's worth seeing if the company's underlying fundamentals have been the driver of long term performance, or if there are some discrepancies.
View our latest analysis for Admiral Group
There is no denying that markets are sometimes efficient, but prices do not always reflect underlying business performance. One imperfect but simple way to consider how the market perception of a company has shifted is to compare the change in the earnings per share (EPS) with the share price movement.
During the unfortunate twelve months during which the Admiral Group share price fell, it actually saw its earnings per share (EPS) improve by 15%. It could be that the share price was previously over-hyped.
It's fair to say that the share price does not seem to be reflecting the EPS growth. So it's easy to justify a look at some other metrics.
We don't see any weakness in the Admiral Group's dividend so the steady payout can't really explain the share price drop. The revenue trend doesn't seem to explain why the share price is down. Unless, of course, the market was expecting a revenue uptick.
The graphic below depicts how earnings and revenue have changed over time (unveil the exact values by clicking on the image).
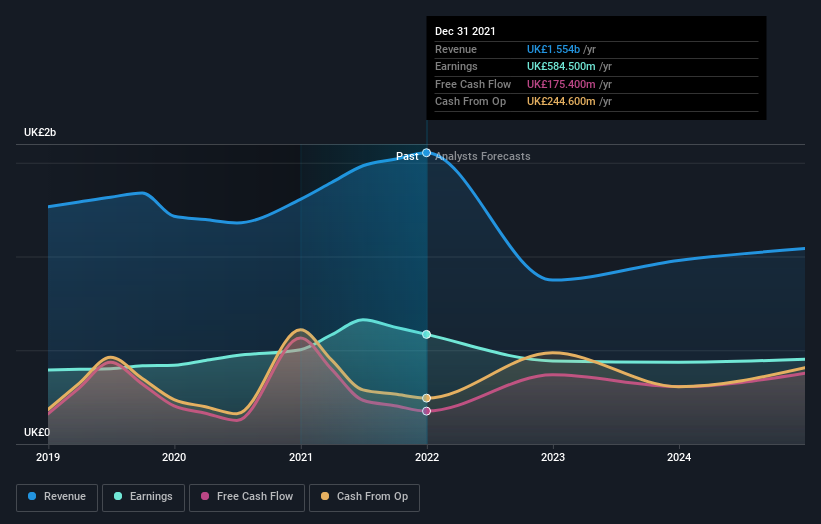
It's good to see that there was some significant insider buying in the last three months. That's a positive. That said, we think earnings and revenue growth trends are even more important factors to consider. If you are thinking of buying or selling Admiral Group stock, you should check out this free report showing analyst profit forecasts.
What About Dividends?
It is important to consider the total shareholder return, as well as the share price return, for any given stock. The TSR is a return calculation that accounts for the value of cash dividends (assuming that any dividend received was reinvested) and the calculated value of any discounted capital raisings and spin-offs. So for companies that pay a generous dividend, the TSR is often a lot higher than the share price return. In the case of Admiral Group, it has a TSR of -15% for the last 1 year. That exceeds its share price return that we previously mentioned. And there's no prize for guessing that the dividend payments largely explain the divergence!
A Different Perspective
Admiral Group shareholders are down 15% for the year (even including dividends), but the market itself is up 0.7%. However, keep in mind that even the best stocks will sometimes underperform the market over a twelve month period. Longer term investors wouldn't be so upset, since they would have made 10%, each year, over five years. It could be that the recent sell-off is an opportunity, so it may be worth checking the fundamental data for signs of a long term growth trend. It's always interesting to track share price performance over the longer term. But to understand Admiral Group better, we need to consider many other factors. Even so, be aware that Admiral Group is showing 4 warning signs in our investment analysis , and 2 of those are concerning...
There are plenty of other companies that have insiders buying up shares. You probably do not want to miss this free list of growing companies that insiders are buying.
Please note, the market returns quoted in this article reflect the market weighted average returns of stocks that currently trade on GB exchanges.
Have feedback on this article? Concerned about the content? Get in touch with us directly. Alternatively, email editorial-team (at) simplywallst.com.
This article by Simply Wall St is general in nature. We provide commentary based on historical data and analyst forecasts only using an unbiased methodology and our articles are not intended to be financial advice. It does not constitute a recommendation to buy or sell any stock, and does not take account of your objectives, or your financial situation. We aim to bring you long-term focused analysis driven by fundamental data. Note that our analysis may not factor in the latest price-sensitive company announcements or qualitative material. Simply Wall St has no position in any stocks mentioned.
