
 Yahoo Finance
 Investors Who Bought Bilfinger (FRA:GBF) Shares Five Years Ago Are Now Down 66%

While not a mind-blowing move, it is good to see that the Bilfinger SE (FRA:GBF) share price has gained 12% in the last three months. But that is little comfort to those holding over the last half decade, sitting on a big loss. Indeed, the share price is down 66% in the period. So we're hesitant to put much weight behind the short term increase. We'd err towards caution given the long term under-performance.
See our latest analysis for Bilfinger
Because Bilfinger is loss-making, we think the market is probably more focussed on revenue and revenue growth, at least for now. When a company doesn't make profits, we'd generally expect to see good revenue growth. That's because fast revenue growth can be easily extrapolated to forecast profits, often of considerable size.
In the last five years Bilfinger saw its revenue shrink by 14% per year. That puts it in an unattractive cohort, to put it mildly. It seems appropriate, then, that the share price slid about 19% annually during that time. We don't generally like to own companies that lose money and don't grow revenues. You might be better off spending your money on a leisure activity. This looks like a really risky stock to buy, at a glance.
The chart below shows how revenue and earnings have changed with time, (if you click on the chart you can see the actual values).
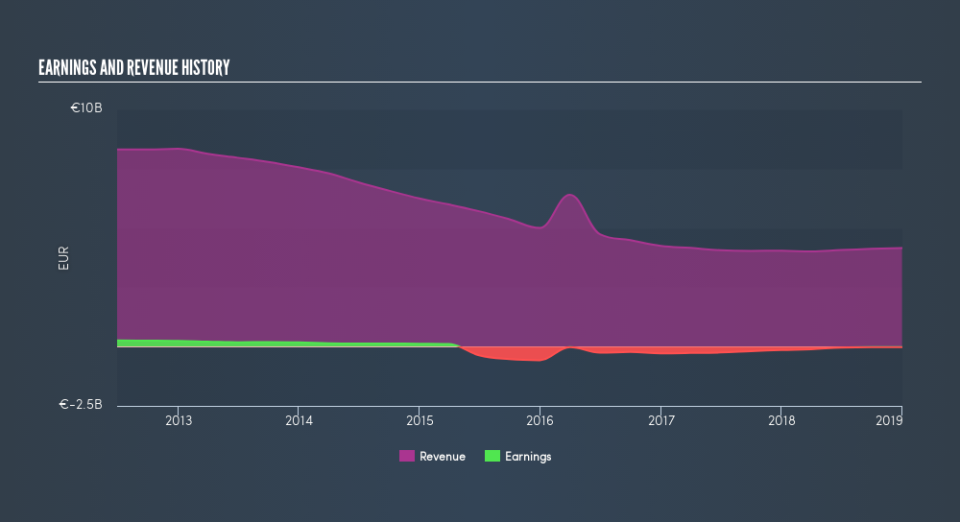
This free interactive report on Bilfinger's balance sheet strength is a great place to start, if you want to investigate the stock further.
What About Dividends?
It is important to consider the total shareholder return, as well as the share price return, for any given stock. Whereas the share price return only reflects the change in the share price, the TSR includes the value of dividends (assuming they were reinvested) and the benefit of any discounted capital raising or spin-off. Arguably, the TSR gives a more comprehensive picture of the return generated by a stock. In the case of Bilfinger, it has a TSR of -61% for the last 5 years. That exceeds its share price return that we previously mentioned. And there's no prize for guessing that the dividend payments largely explain the divergence!
A Different Perspective
We regret to report that Bilfinger shareholders are down 14% for the year (even including dividends). Unfortunately, that's worse than the broader market decline of 5.0%. However, it could simply be that the share price has been impacted by broader market jitters. It might be worth keeping an eye on the fundamentals, in case there's a good opportunity. However, the loss over the last year isn't as bad as the 17% per annum loss investors have suffered over the last half decade. We would want clear information suggesting the company will grow, before taking the view that the share price will stabilize. Before forming an opinion on Bilfinger you might want to consider the cold hard cash it pays as a dividend. This free chart tracks its dividend over time.
If you would prefer to check out another company -- one with potentially superior financials -- then do not miss this free list of companies that have proven they can grow earnings.
Please note, the market returns quoted in this article reflect the market weighted average returns of stocks that currently trade on DE exchanges.
We aim to bring you long-term focused research analysis driven by fundamental data. Note that our analysis may not factor in the latest price-sensitive company announcements or qualitative material.
If you spot an error that warrants correction, please contact the editor at editorial-team@simplywallst.com. This article by Simply Wall St is general in nature. It does not constitute a recommendation to buy or sell any stock, and does not take account of your objectives, or your financial situation. Simply Wall St has no position in the stocks mentioned. Thank you for reading.
