
 Yahoo Finance
 Investors Who Bought Capita (LON:CPI) Shares Five Years Ago Are Now Down 85%

Capita plc (LON:CPI) shareholders should be happy to see the share price up 19% in the last quarter. But spare a thought for the long term holders, who have held the stock as it bled value over the last five years. Indeed, the share price is down a whopping 85% in that time. While the recent increase might be a green shoot, we're certainly hesitant to rejoice. The real question is whether the business can leave its past behind and improve itself over the years ahead.
We really hope anyone holding through that price crash has a diversified portfolio. Even when you lose money, you don't have to lose the lesson.
Check out our latest analysis for Capita
To quote Buffett, 'Ships will sail around the world but the Flat Earth Society will flourish. There will continue to be wide discrepancies between price and value in the marketplace...' By comparing earnings per share (EPS) and share price changes over time, we can get a feel for how investor attitudes to a company have morphed over time.
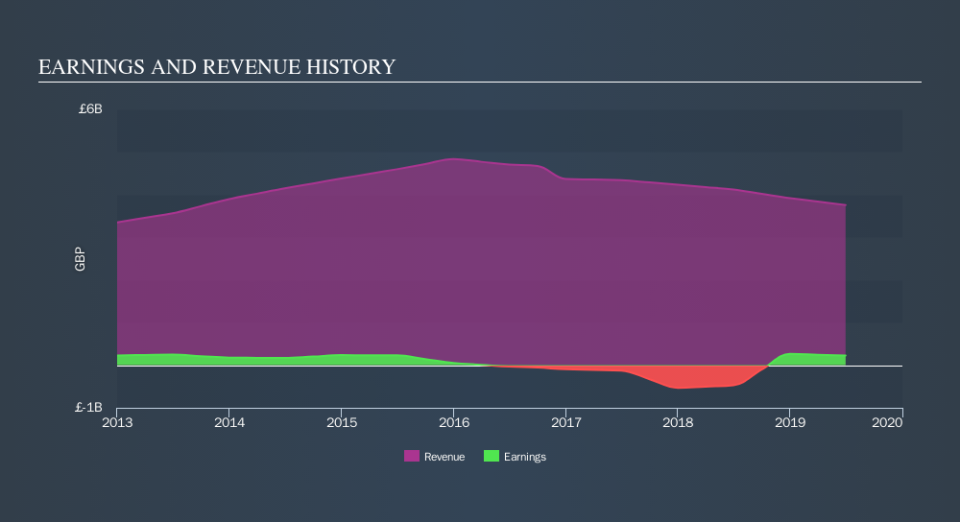
During five years of share price growth, Capita moved from a loss to profitability. That would generally be considered a positive, so we are surprised to see the share price is down. Other metrics might give us a better handle on how its value is changing over time.
It could be that the revenue decline of 3.0% per year is viewed as evidence that Capita is shrinking. This has probably encouraged some shareholders to sell down the stock.
The graphic below depicts how earnings and revenue have changed over time (unveil the exact values by clicking on the image).
Capita is well known by investors, and plenty of clever analysts have tried to predict the future profit levels. If you are thinking of buying or selling Capita stock, you should check out this free report showing analyst consensus estimates for future profits.
What about the Total Shareholder Return (TSR)?
We'd be remiss not to mention the difference between Capita's total shareholder return (TSR) and its share price return. The TSR is a return calculation that accounts for the value of cash dividends (assuming that any dividend received was reinvested) and the calculated value of any discounted capital raisings and spin-offs. Dividends have been really beneficial for Capita shareholders, and that cash payout explains why its total shareholder loss of 73%, over the last 5 years, isn't as bad as the share price return.
A Different Perspective
It's nice to see that Capita shareholders have received a total shareholder return of 25% over the last year. Notably the five-year annualised TSR loss of 23% per year compares very unfavourably with the recent share price performance. The long term loss makes us cautious, but the short term TSR gain certainly hints at a brighter future. Most investors take the time to check the data on insider transactions. You can click here to see if insiders have been buying or selling.
Of course Capita may not be the best stock to buy. So you may wish to see this free collection of growth stocks.
Please note, the market returns quoted in this article reflect the market weighted average returns of stocks that currently trade on GB exchanges.
We aim to bring you long-term focused research analysis driven by fundamental data. Note that our analysis may not factor in the latest price-sensitive company announcements or qualitative material.
If you spot an error that warrants correction, please contact the editor at editorial-team@simplywallst.com. This article by Simply Wall St is general in nature. It does not constitute a recommendation to buy or sell any stock, and does not take account of your objectives, or your financial situation. Simply Wall St has no position in the stocks mentioned. Thank you for reading.
