
 Yahoo Finance
 Investors Who Bought Clipper Logistics Shares A Year Ago Are Now Down 31%

Clipper Logistics plc (LON:CLG) shareholders should be happy to see the share price up 11% in the last month. But that doesn’t change the fact that the returns over the last year have been less than pleasing. The cold reality is that the stock has dropped 31% in one year, under-performing the market.
Check out our latest analysis for Clipper Logistics
While markets are a powerful pricing mechanism, share prices reflect investor sentiment, not just underlying business performance. One imperfect but simple way to consider how the market perception of a company has shifted is to compare the change in the earnings per share (EPS) with the share price movement.
Even though the Clipper Logistics share price is down over the year, its EPS actually improved. Of course, the situation might betray previous over-optimism about growth. It’s surprising to see the share price fall so much, despite the improved EPS. So it’s easy to justify a look at some other metrics.
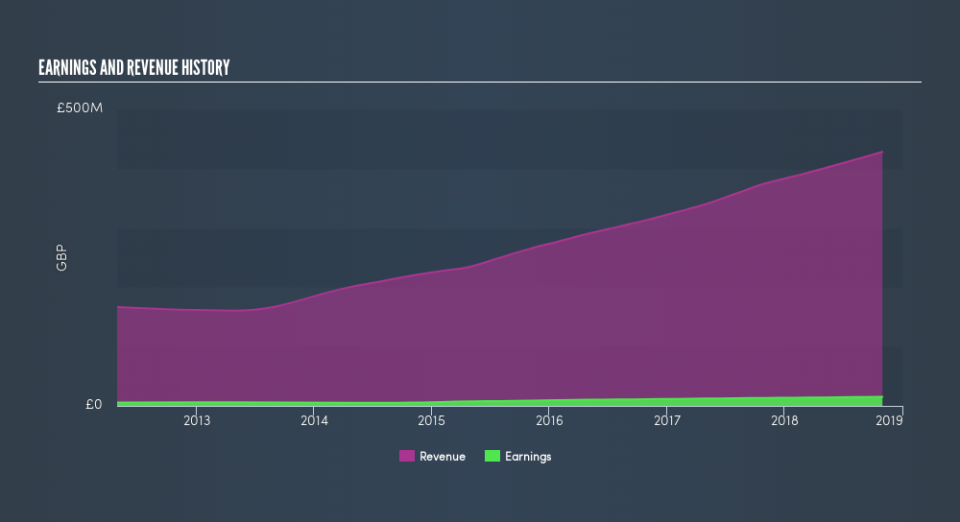
Clipper Logistics managed to grow revenue over the last year, which is usually a real positive. Since we can’t easily explain the share price movement based on these metrics, it might be worth considering how market sentiment has changed towards the stock.
Depicted in the graphic below, you’ll see revenue and earnings over time. If you want more detail, you can click on the chart itself.
We consider it positive that insiders have made significant purchases in the last year. Even so, future earnings will be far more important to whether current shareholders make money. You can see what analysts are predicting for Clipper Logistics in this interactive graph of future profit estimates.
What About Dividends?
When looking at investment returns, it is important to consider the difference between total shareholder return (TSR) and share price return. The TSR is a return calculation that accounts for the value of cash dividends (assuming that any dividend received was reinvested) and the calculated value of any discounted capital raisings. Arguably, the TSR gives a more comprehensive picture of the return generated by a stock. We note that for Clipper Logistics the TSR over the last year was -29%, which is better than the share price return mentioned above. The dividends paid by the company have thusly boosted the total shareholder return.
A Different Perspective
The last twelve months weren’t great for Clipper Logistics shares, which cost holders 29%, including dividends, while the market was up about 3.4%. However, keep in mind that even the best stocks will sometimes underperform the market over a twelve month period. Fortunately the longer term story is brighter, with total returns averaging about 3.7% per year over three years. The recent sell-off could be an opportunity if the business remains sound, so it may be worth checking the fundamental data for signs of a long-term growth trend. Investors who like to make money usually check up on insider purchases, such as the price paid, and total amount bought. You can find out about the insider purchases of Clipper Logistics by clicking this link.
Clipper Logistics is not the only stock that insiders are buying. For those who like to find winning investments this free list of growing companies with recent insider purchasing, could be just the ticket.
Please note, the market returns quoted in this article reflect the market weighted average returns of stocks that currently trade on GB exchanges.
We aim to bring you long-term focused research analysis driven by fundamental data. Note that our analysis may not factor in the latest price-sensitive company announcements or qualitative material.
If you spot an error that warrants correction, please contact the editor at editorial-team@simplywallst.com. This article by Simply Wall St is general in nature. It does not constitute a recommendation to buy or sell any stock, and does not take account of your objectives, or your financial situation. Simply Wall St has no position in the stocks mentioned. Thank you for reading.