
 Yahoo Finance
 Investors Who Bought Direct Line Insurance Group (LON:DLG) Shares Five Years Ago Are Now Up 12%

Want to participate in a short research study? Help shape the future of investing tools and you could win a $250 gift card!
Generally speaking the aim of active stock picking is to find companies that provide returns that are superior to the market average. And while active stock picking involves risks (and requires diversification) it can also provide excess returns. For example, long term Direct Line Insurance Group plc (LON:DLG) shareholders have enjoyed a 12% share price rise over the last half decade, well in excess of the market return of around 5.1% (not including dividends). On the other hand, the more recent gains haven't been so impressive, with shareholders gaining just 0.6%, including dividends.
See our latest analysis for Direct Line Insurance Group
To paraphrase Benjamin Graham: Over the short term the market is a voting machine, but over the long term it's a weighing machine. One imperfect but simple way to consider how the market perception of a company has shifted is to compare the change in the earnings per share (EPS) with the share price movement.
Over half a decade, Direct Line Insurance Group managed to grow its earnings per share at 8.1% a year. This EPS growth is higher than the 2.3% average annual increase in the share price. Therefore, it seems the market has become relatively pessimistic about the company. This cautious sentiment is reflected in its (fairly low) P/E ratio of 9.70.
The company's earnings per share (over time) is depicted in the image below (click to see the exact numbers).
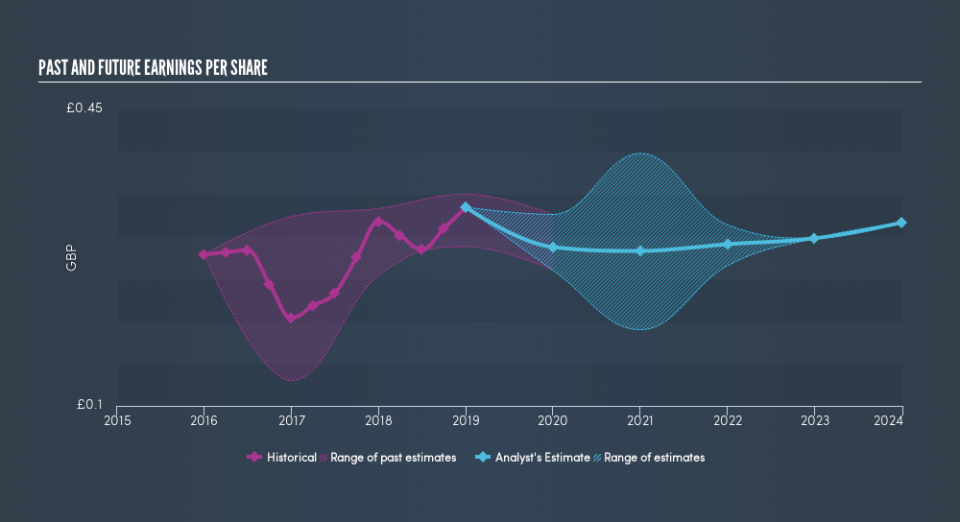
It might be well worthwhile taking a look at our free report on Direct Line Insurance Group's earnings, revenue and cash flow.
What About Dividends?
It is important to consider the total shareholder return, as well as the share price return, for any given stock. The TSR incorporates the value of any spin-offs or discounted capital raisings, along with any dividends, based on the assumption that the dividends are reinvested. So for companies that pay a generous dividend, the TSR is often a lot higher than the share price return. We note that for Direct Line Insurance Group the TSR over the last 5 years was 82%, which is better than the share price return mentioned above. This is largely a result of its dividend payments!
A Different Perspective
Direct Line Insurance Group provided a TSR of 0.6% over the last twelve months. But that return falls short of the market. On the bright side, the longer term returns (running at about 13% a year, over half a decade) look better. It's quite possible the business continues to execute with prowess, even as the share price gains are slowing. If you would like to research Direct Line Insurance Group in more detail then you might want to take a look at whether insiders have been buying or selling shares in the company.
Of course Direct Line Insurance Group may not be the best stock to buy. So you may wish to see this free collection of growth stocks.
Please note, the market returns quoted in this article reflect the market weighted average returns of stocks that currently trade on GB exchanges.
We aim to bring you long-term focused research analysis driven by fundamental data. Note that our analysis may not factor in the latest price-sensitive company announcements or qualitative material.
If you spot an error that warrants correction, please contact the editor at editorial-team@simplywallst.com. This article by Simply Wall St is general in nature. It does not constitute a recommendation to buy or sell any stock, and does not take account of your objectives, or your financial situation. Simply Wall St has no position in the stocks mentioned. Thank you for reading.
